In Lecture 10 we looked at a few approaches to using hooks and plotting information about means and standard deviations of our network’s activations.
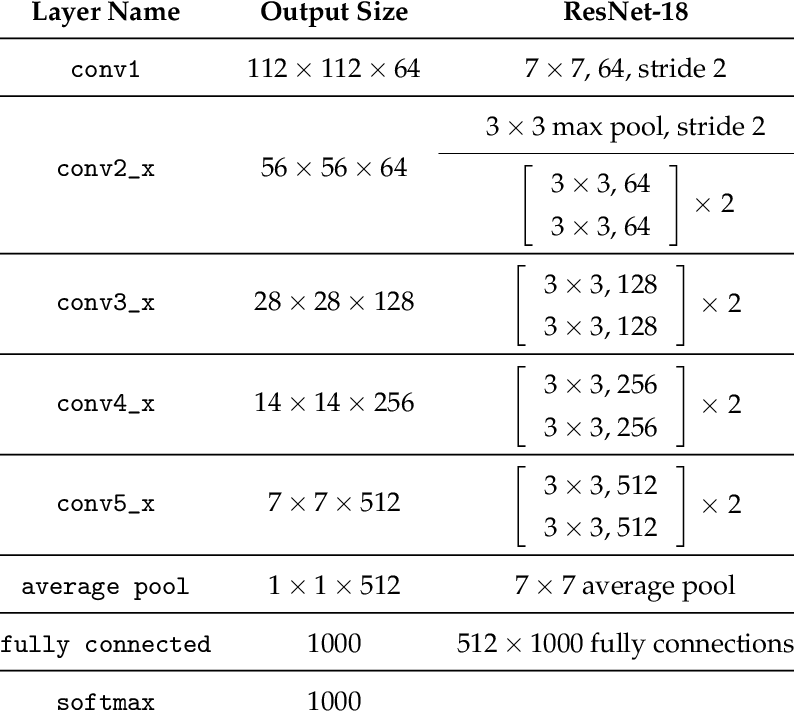
This seems like it might be useful as a debugging strategy or sanity check on real-world models, so I wanted to try to instrument my own network. For simplicity’s sake I chose to ResNet-18 against the MNIST dataset.
I’ve chosen to instrument conv1, conv2_x, conv3_x, conv4_x, and conv5_x.
I ran .fit() for 3 epochs using a learning rate of 1e-2. I used a validation size of 50% because the graphs start to get too wide if there are too many items in the training set.
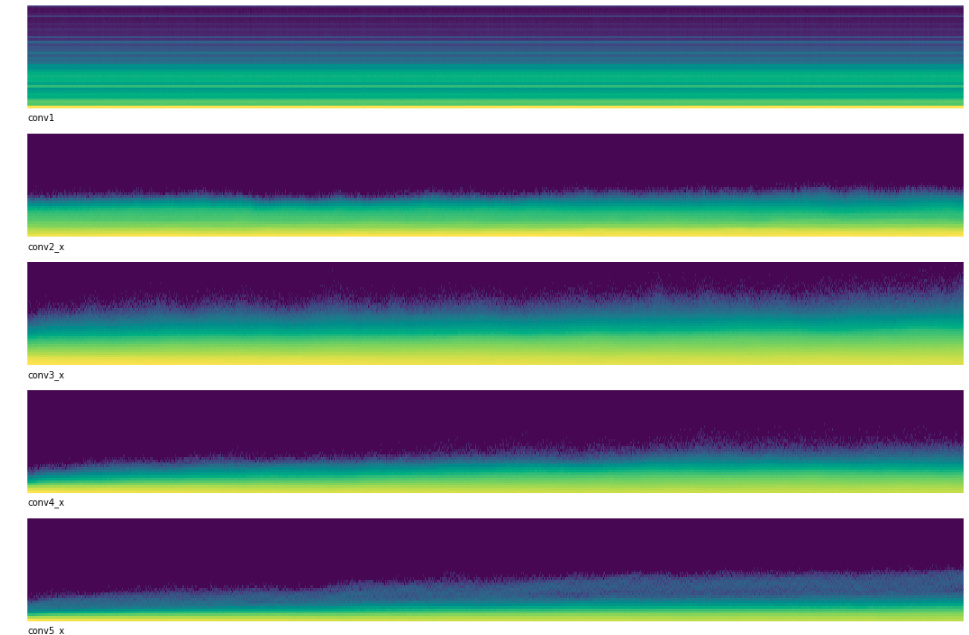
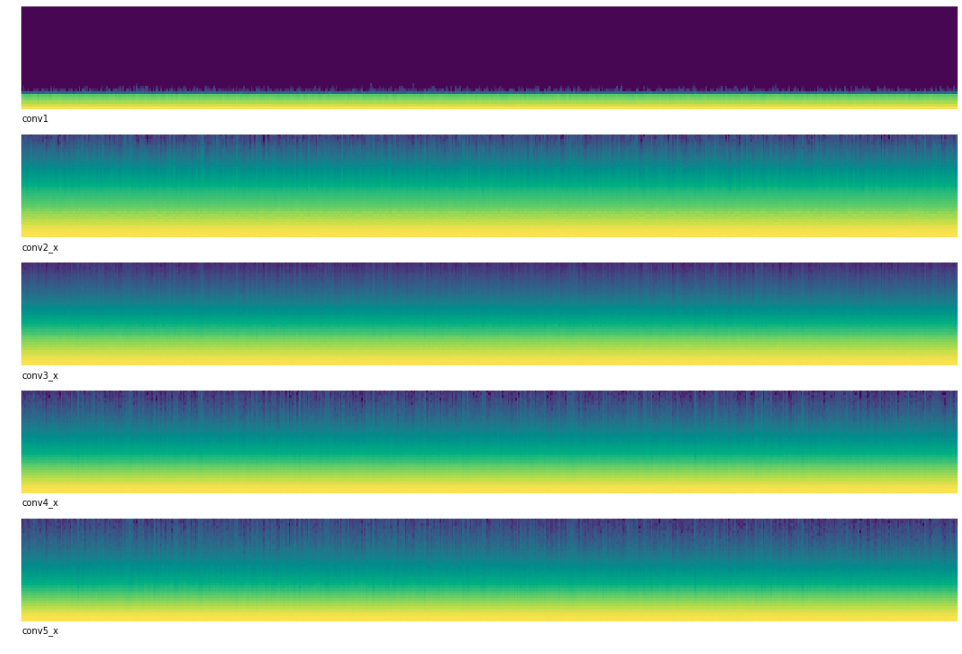
The untrained model’s weights descend into some kind of pattern. In general it looks like most of the activations are collapsing to values closer to zero.
Right away something seems wrong with the first convolutional layer. It looks like very few activations have a high value and most are clustered around zero.
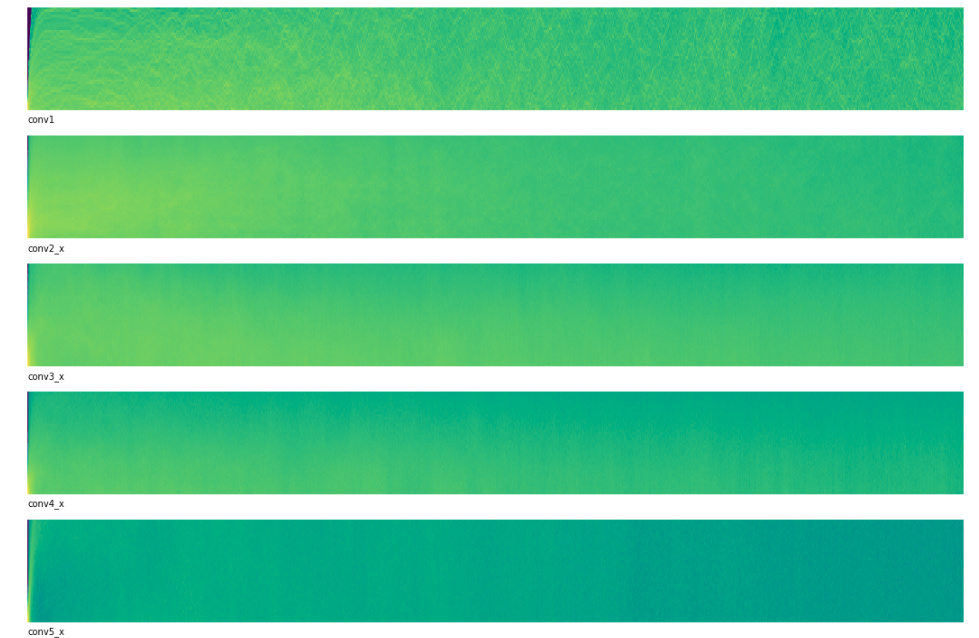
I gave this some thought and realized it was probably because I was using discriminative learning rates. This particular Kaggle contest doesn’t let us use pre-trained models and I was just in auto-pilot from all of my previous work/contests.
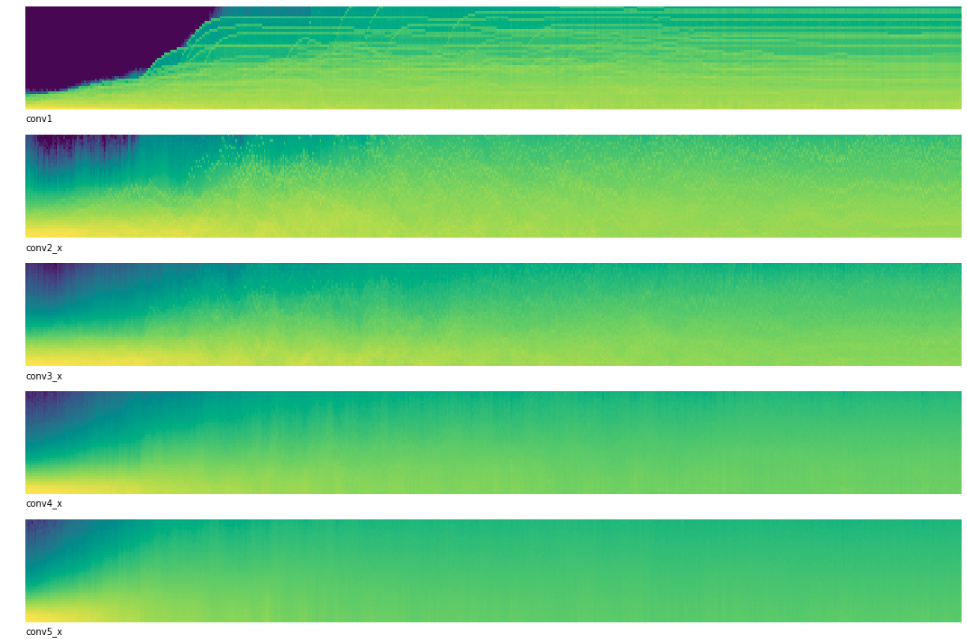
This looks much better! It seems like it will improve things as my f1score improved from 0.238104 to 0.468753 with a corresponding improvement in loss.
Really interesting, and as you pointed out, also useful to debug and understand what is happening in the learning process.
BTW, good luck with the competition, I’m currently sitting at the 4th place without having ever touched to audio and without doing this kind of analysis, so I’m confident that you can get even better result than me
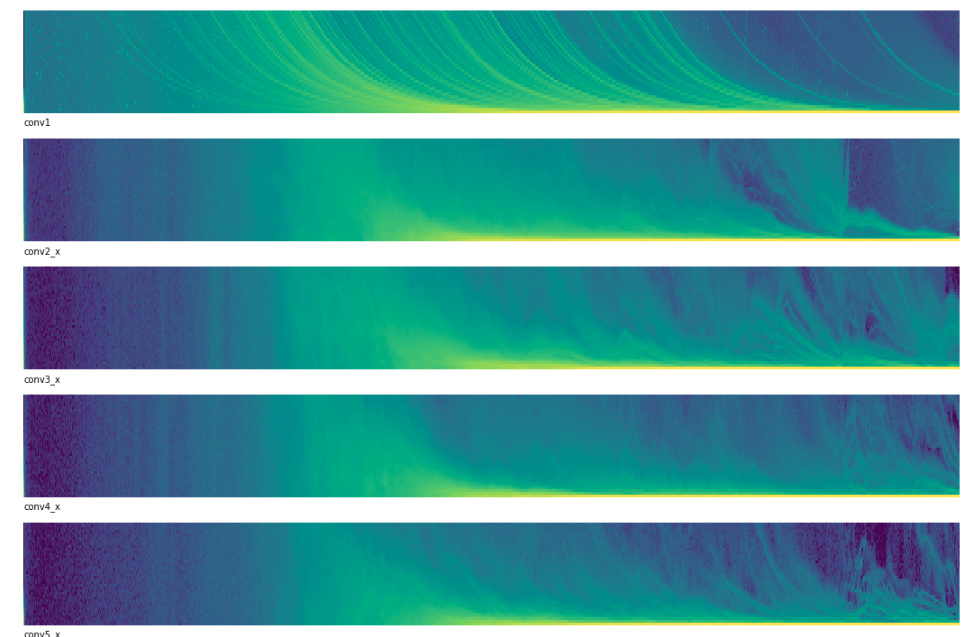
how you would interpret from graphs about the density of values
. I mean what does yellow shade and purple shed interpret to…
The x-axis represents time.
The y-axis represents the magnitude of the activations. Yellow represents “A lot of activations at this magnitutde” while blue represents “Not very many activations at this magnitutde”. At the beginning of training you can see that the upper portions of the plot are mostly blue, meaning that most activations are around 0.
BTW, good luck with the competition, I’m currently sitting at the 4th place without having ever touched to audio and without doing this kind of analysis, so I’m confident that you can get even better result than me
4th place, that’s awesome!
I’ve actually never done anything with audio either so I don’t share your confidence quite yet haha. I haven’t incorporated the noisy dataset at all yet so I’m hoping there’s still a lot of room for improvement.
If you’re ever interested in teaming up on a competition feel free to let me know.
This is very nice Josh, thanks! I wonder if there’s some way to programatically include this info during model training; maybe using the callback structure to check the “activation density” and adjust the LR accordingly…
@immaried Sorry, they’re all supposed to represent activations. I mistakenly referred to them as “weights” and can’t edit the post since it’s been so long.