EDIT: Adding in the bash version becasue it’s way easier:
Python version:
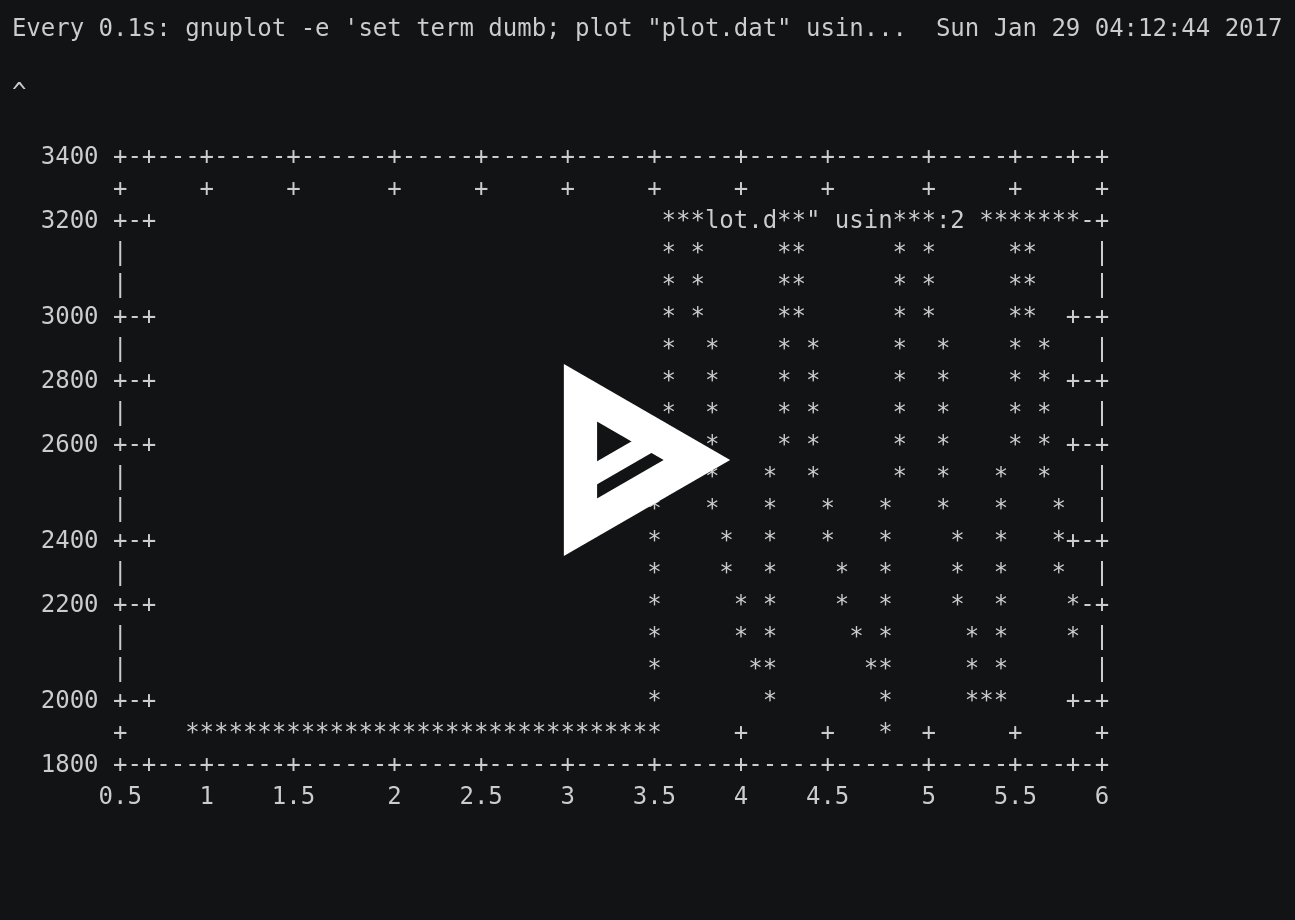
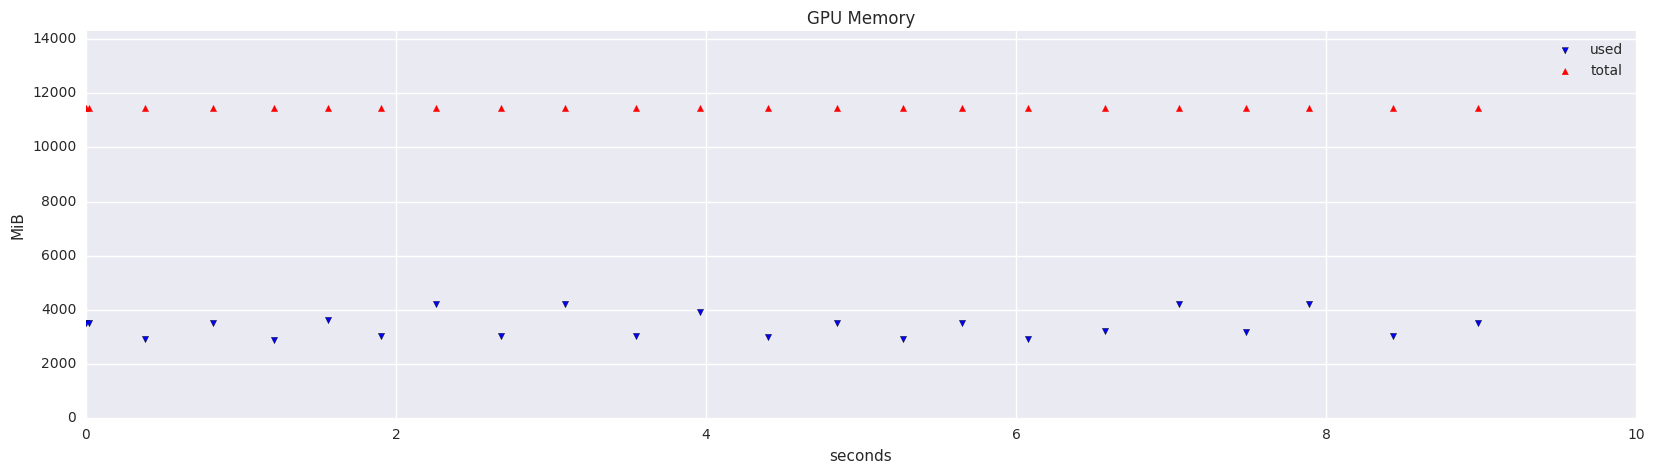
I made a little python notebook to monitor GPU memory usage after getting a few OOMs. It uses nvidia-smi --display=MEMORY -q, to query memory stats. It can only update a few times per second because I’m using matplotlib inefficiently.
If anyone can figure out how to run it in parallel with model fitting in a single notebook, let me know!
Yes, that’s exactly what I’m doing. It would be great to have it run in parallel in a cell right above/below the training cell, but I could not figure out how to do that.
You can probably do something like what you want with IPython widgets.
This isn’t a graph, but it will display the same information. The way I’ve written it you need to update it manually with update_widget, but I’m sure someone else will know how to get it to update at timed intervals asynchronously.
import ipywidgets as widgets
from IPython.display import display
from subprocess import check_output

def nvidia_smi(options=['-q','-d','MEMORY']):
    return check_output(['nvidia-smi'] + options)

def update_widget(w=None, new_box=False):
    if w is None:
        w = widgets.Textarea(
            value=nvidia_smi(),
            placeholder='nvidia-smi output',
            width=100,
            disabled=False
        )
        display(w)
        return w
    else:
        w.value = nvidia_smi()
        if new_box:
            return w
        else:
            return None

# display widget and get handle
w = update_widget()

# update info in widget
update_widget(w)
Although FYI, this does not seem to be helpful with the TensorFlow backend. TF seems to use all memory by default, so it doesn’t give any warning signs that it is going to go out of memory.
If anyone has any advice on dealing with that, please let me know.