I created a tabular_learner like this.
learn = tabular_learner(data, layers=[16], metrics=[accuracy], use_bn=False)
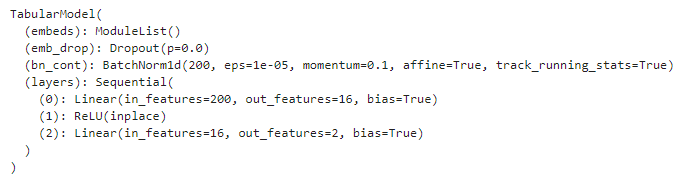
Input of this model has 200 columns and I am trying to predict a single target variable (which is a probability). When I do learn.model, I get below output.
Question is why do I have out_features as 2 (in the last layer)? It should be 1 (since I am predicting one target value), isn’t it?
I suggest making sure that you are selecting as output an actual continuous variable, because if you are, normally you shouldn’t be allowed to have accuracy as a metric for the tabular_learner.
My output is actually a probability. Can it be a reason why output feature is 2? (One for the probability of true and other for the probability of false?).
Why do you say for continuous variable
you shouldn’t be allowed to have accuracy as a metric
I would understand that probability is a continuous variable from 0.0 to 1.0. If your output is either 0 or 1, it’s a categorical variable and therefore it’s normal to have 2 outputs, one for each possible output or class.
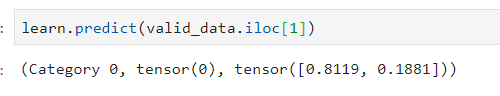
And the output contains the predicted class and the probability of each of the possible classes.
It’s giving you the probabilities of ‘0’ & ‘1’, for example. So when you do learn.get_preds, it gives you a tensor, where the first value is probability of ‘0’ and second value is probability of ‘1’.
I thought the probability of zero is (1 - the probability of One).
Consider a scenario where Y = 1. So how does the model get (Y^ - Y) with these 2 output features?
If you can also point me the code, it will be great.
You can do doc(BCEFlat) in a notebook and it will take you to the Fastai Docs for the loss function. BCEFlat is built on pytorch’s nn.BCELoss. The Fastai docs are wonderful, with links directly to the source code.
It calculates (Y^ - Y) for each class (or output feature). So if your target is ‘0’ or ‘1’, you have two classes. As your model goes through its layers, it works to minimize the loss for each prediction for each class.
I was having trouble running this model against a different CSV file and went back to the original. When I run a copy of that, I get results identical to what was shown in the lesson, except learn.predict. The prediction is wrong and the tensor values seem to be the reverse of what they should be. I added the row command to make sure.
Hello Everyone,
I want to ask a more general question- What is fastai’s tabular learner? What actually goes in, and what comes out of it? How, and where in the model do categorical and continuos variables combine, and how are they treated individually in the earlier layers?
If someone can provide an explanation, or a link to one, that would be great!
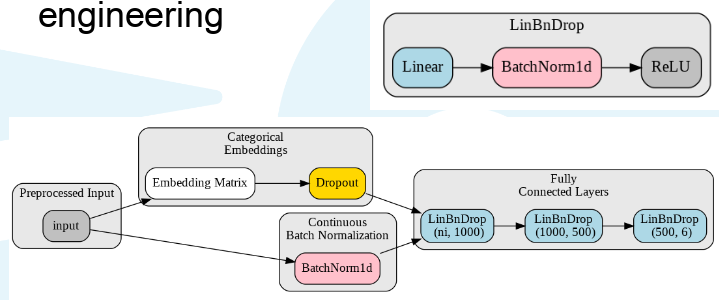
Now we can see that our continuous variables go into batch normalization while the categorical first into an embedding matrix (a look up table of sorts) before applying any drop out. Afterwards they get concatenated and fed through 2-3 fully connected LinBnDrop layers. This example has my layer selection as [1000,500]. Also visualization was made with the fastdot library.