I’m using the out of the box fast ai collab learner
learn = collab_learner(dls, n_factors=50, y_range=(0, 5.5)) .
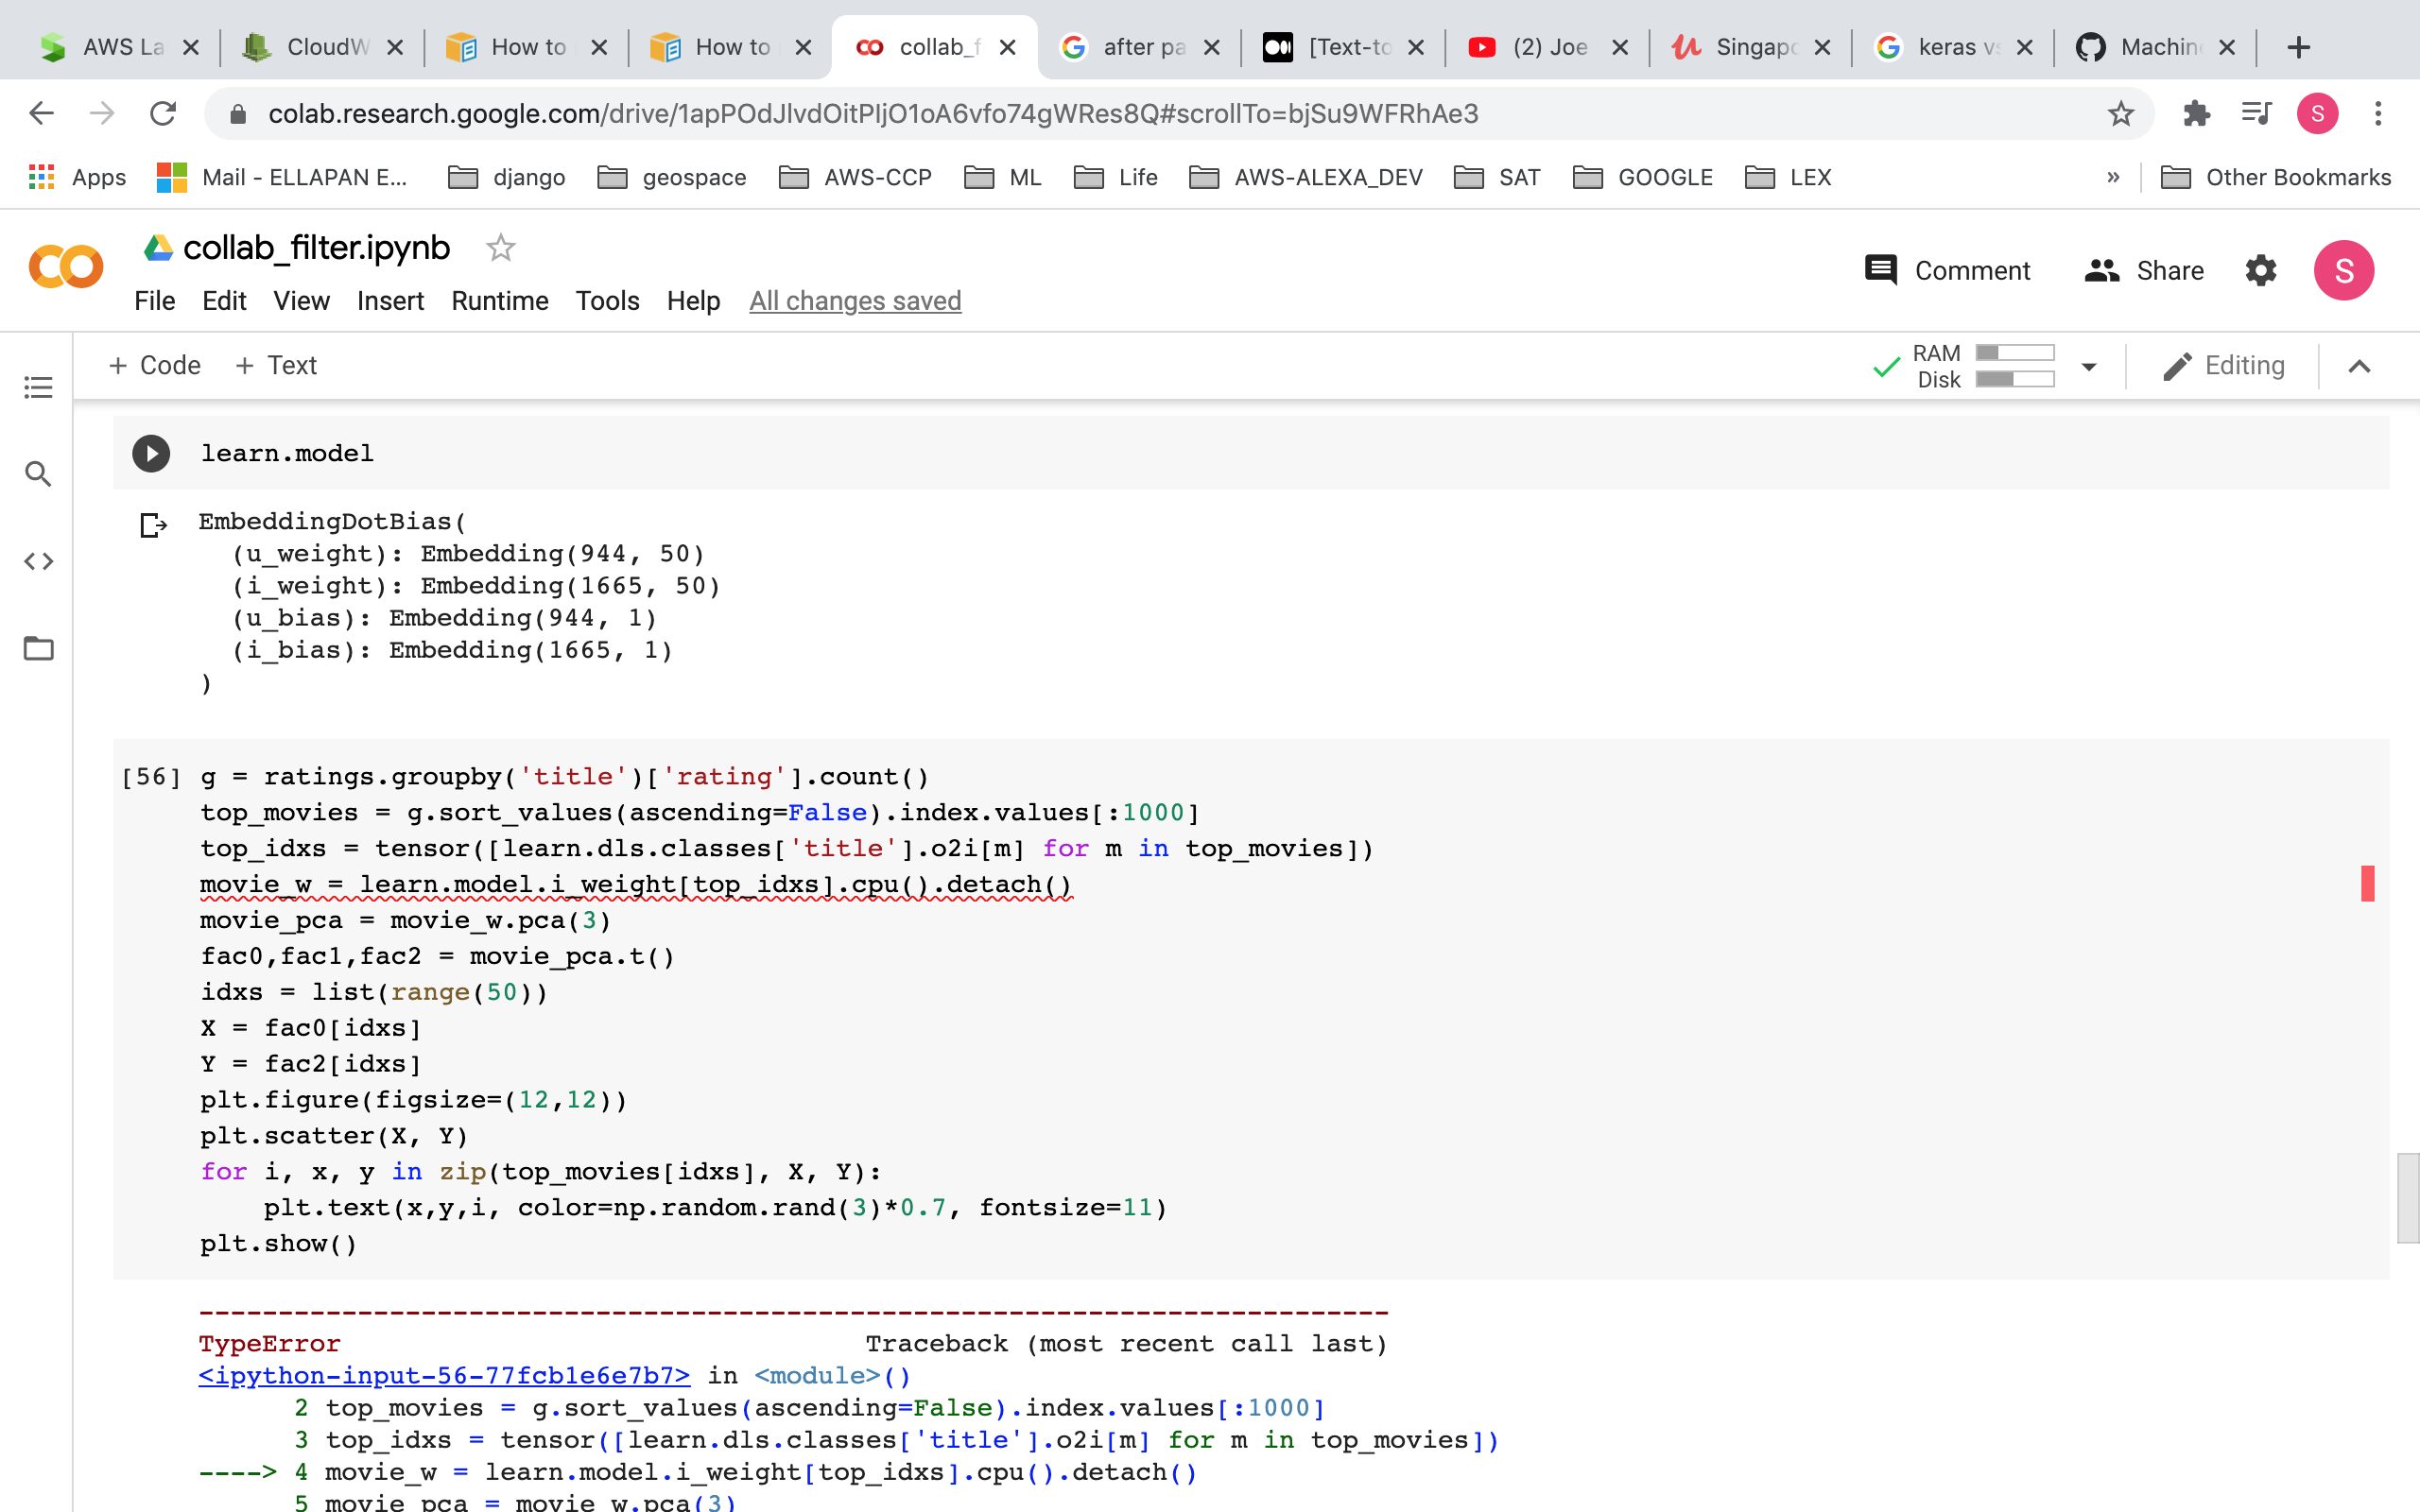
When I try to visualize the embedding distance:
g = ratings.groupby('title')['rating'].count()
top_movies = g.sort_values(ascending=False).index.values[:1000]
top_idxs = tensor([learn.dls.classes['title'].o2i[m] for m in top_movies])
movie_w = learn.model.i_weight[top_idxs].cpu().detach()
movie_pca = movie_w.pca(3)
fac0,fac1,fac2 = movie_pca.t()
idxs = list(range(50))
X = fac0[idxs]
Y = fac2[idxs]
plt.figure(figsize=(12,12))
plt.scatter(X, Y)
for i, x, y in zip(top_movies[idxs], X, Y):
plt.text(x,y,i, color=np.random.rand(3)*0.7, fontsize=11)
plt.show()
and I am faced with the issue as shown in the picture …
I changed the original code that was given to be able to support the model version (original code) :
g = ratings.groupby(‘title’)[‘rating’].count()
top_movies = g.sort_values(ascending=False).index.values[:1000]
top_idxs = tensor([learn.dls.classes[‘title’].o2i[m] for m in top_movies])
movie_w = learn.model.movie_factors[top_idxs].cpu().detach()
movie_pca = movie_w.pca(3)
fac0,fac1,fac2 = movie_pca.t()
idxs = list(range(50))
X = fac0[idxs]
Y = fac2[idxs]
plt.figure(figsize=(12,12))
plt.scatter(X, Y)
for i, x, y in zip(top_movies[idxs], X, Y):
plt.text(x,y,i, color=np.random.rand(3)*0.7, fontsize=11)
plt.show()