Hi again, @balnazzar
As I mentioned earlier you can profile your GPU processing from Pytorch:
Documentation:
torch.autograd.profiler.profile
torch.autograd.profiler.emit_nvtx
torch.autograd.profiler.load_nvprof
nvidia-tools-extension-nvtx
Another useful information is cuda-memory-management :
PyTorch uses a caching memory allocator to speed up memory allocations. This allows fast memory deallocation without device synchronizations. However, the unused memory managed by the allocator will still show as if used in
nvidia-smi.
Analysis Tools
To be able to do that you need to save the jupyter script into a python script so the profile can identify you GPU correctly
Nvidia Profiler
nvprof --profile-from-start off -o training.prof -f -- python3 script.py
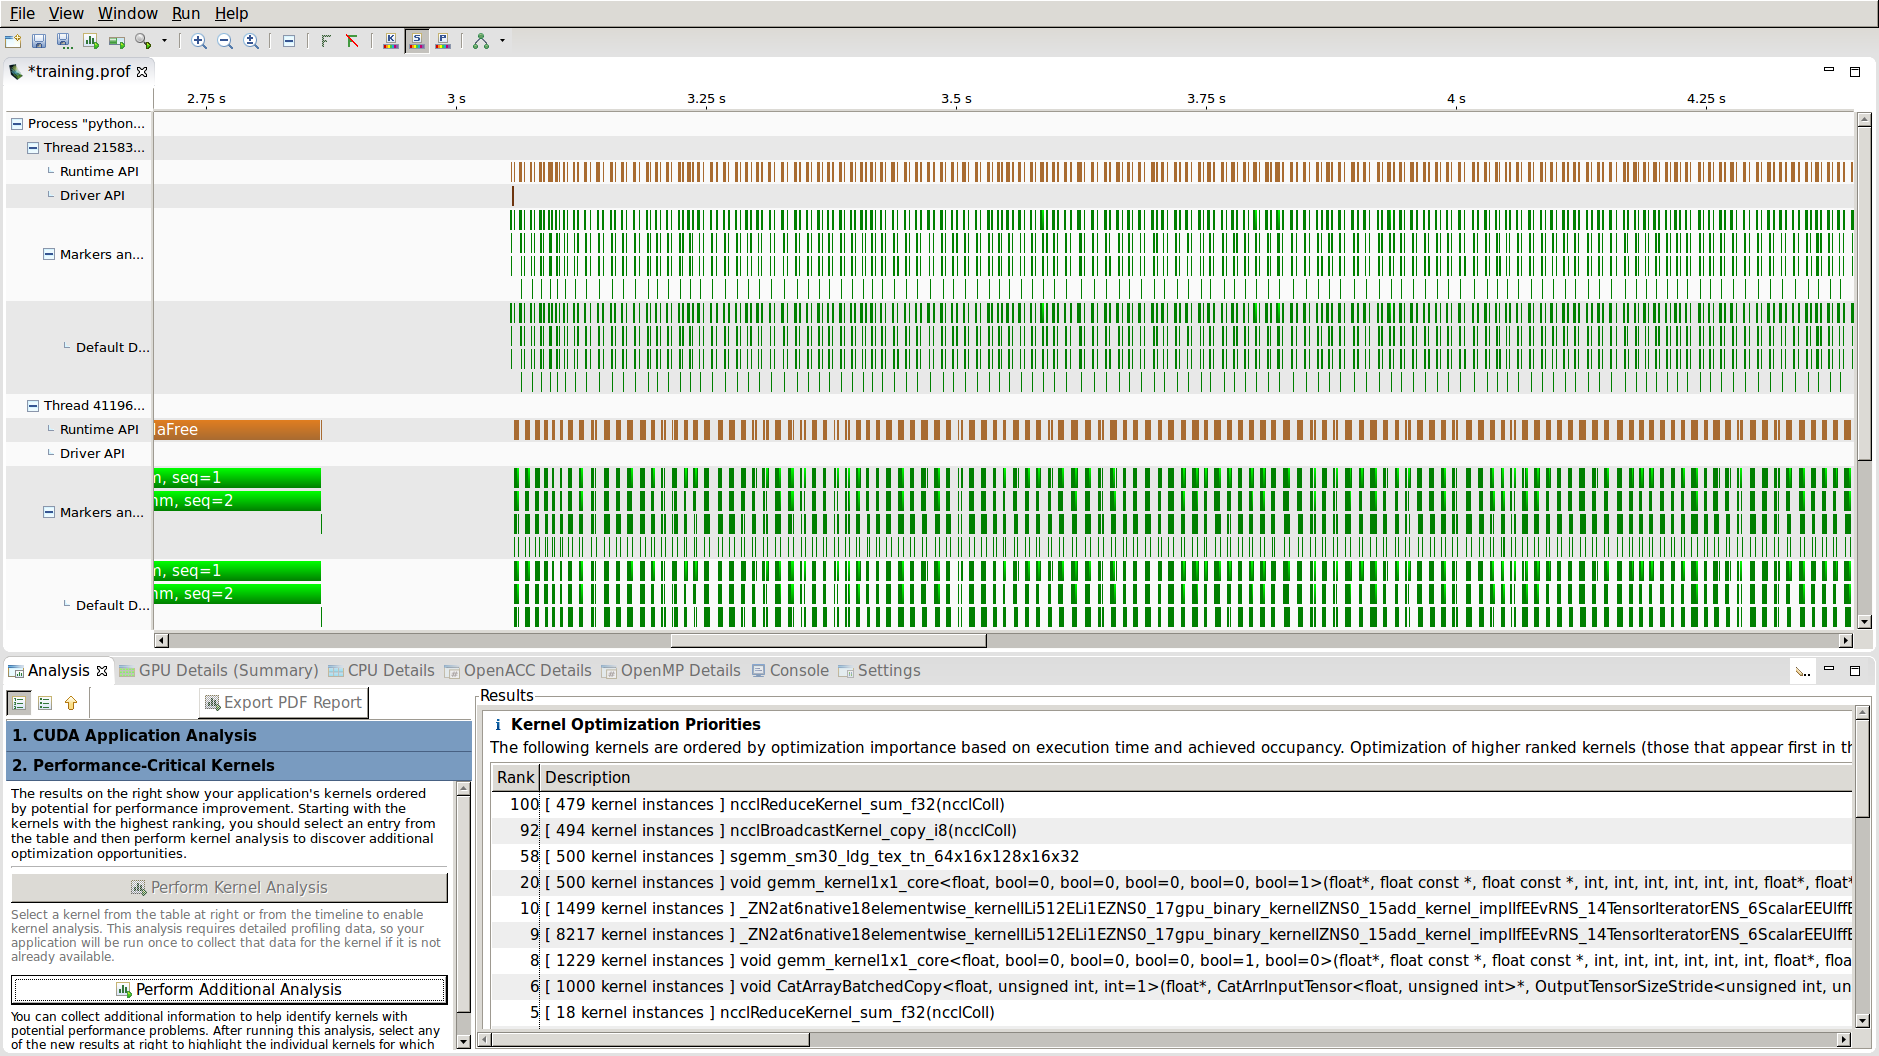
Nvidia Visual Profiler
nvvp training.prof
Or this one:
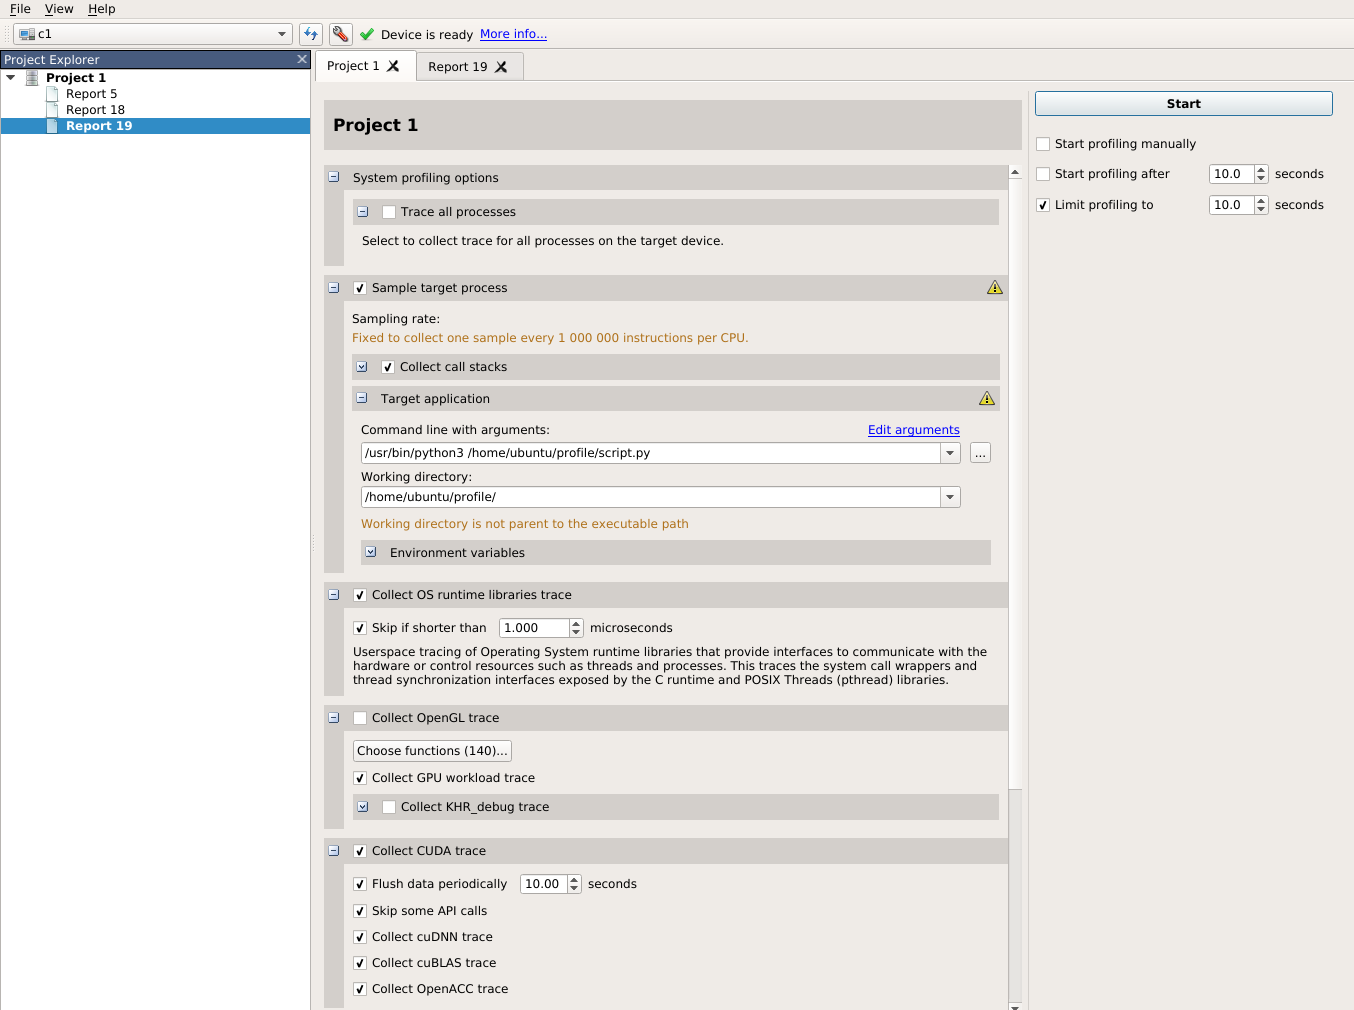
Nvidia Nsight-Systems

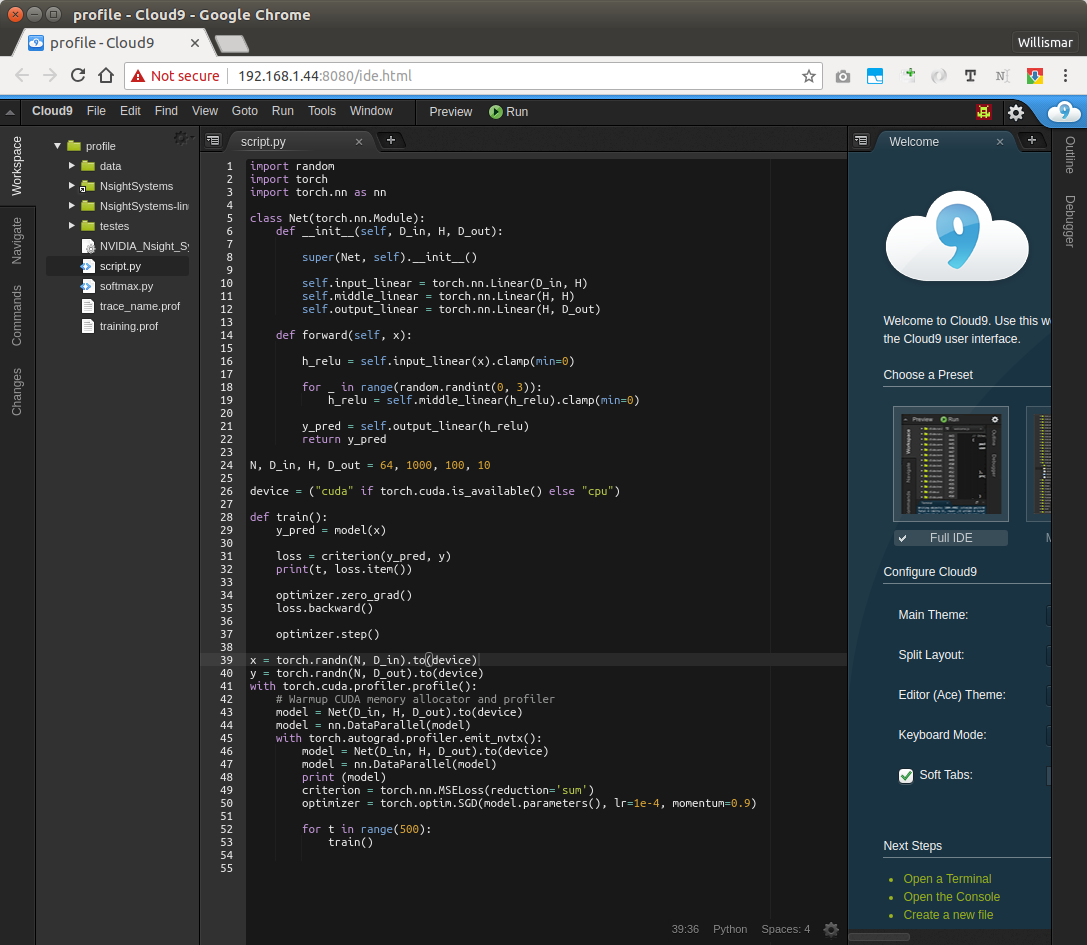
Code Used in the Screen Shots
Now is up to you choose the way to analyse your GPU and code