Tips and Tricks: What might a self-taught person might have missed?

Jeremy mentioned in the lecture that sometimes people miss things that could be very useful like the debugger. I thought maybe we can all add stuff that we don’t see people talking about here and maybe each of us can learn something really useful.

So here’s one small one from me.

In IPython/Jupyter we know we can do stuff like ?np.allclose to get the documentation. But what if we don’t remember the name itself. Auto complete will help if you knew it started with all. But what if you remember there was close in the method name and that’s it.

You can use ?np.close to search the namespace easily. So running the above will give you the below

np.allclose
np.isclose
np.real_if_close

Add yours in the thread. Might be useful for everyone

7 Likes

IPython question mark magic accepts wildcards:

In [17]: ?np.*close*
np.allclose
np.isclose
np.real_if_close
16 Likes

Don’t forget the jupyter notebook shortcuts…(inspired by Jeremy)

It really comes in handy

2 Likes

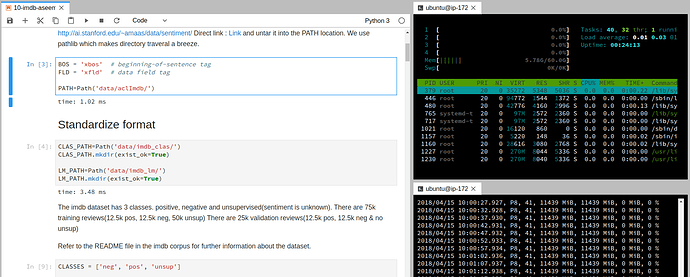
Was previously using nvidia-smi dmon, but this is what I use to keep an eye on the GPU now

nvidia-smi --query-gpu=timestamp,pstate,temperature.gpu,memory.total,memory.free,memory.used --format=csv -l 5

It outputs in the following format

timestamp, pstate, temperature.gpu, memory.total [MiB], memory.free [MiB], memory.used [MiB]
2018/03/21 15:33:24.573, P0, 63, 11441 MiB, 8115 MiB, 3326 MiB
2018/03/21 15:33:29.574, P0, 65, 11441 MiB, 8115 MiB, 3326 MiB
2018/03/21 15:33:34.575, P0, 66, 11441 MiB, 8115 MiB, 3326 MiB

More details here. http://nvidia.custhelp.com/app/answers/detail/a_id/3751/~/useful-nvidia-smi-queries

7 Likes

Thanks for the tip. Wouldn’t you want utilization.gpu too?

2 Likes

Yeah , they’re ( utilization.gpu and utilization.memory) probably good to keep of track too, but maybe not as straightforward to understand. (since it’s a percentage of time)

To be honest, I’ve just stuck with simple metrics for now. Most of time I’m only looking at memory usage anyway.

Watching gpu processor use is important. If it’s less than 90% you aren’t taking good advantage of your gpu

5 Likes

I guess SimpleNamespace is especially cool for notebook-like code: typing params.width feels nicer instead of params['width']. Also, IPython tab completion works with attributes.

4 Likes

These are all handy tips - new to me, thanks!

IntellijIDEA tips and tricks. Lot of it is applicable for PyCharm. Makes it a really pleasant experience to work with JetBrains products whether Intellij or PyCharm.

2 Likes

Using htop alongwith the notebook in a terminal makes the connection not break if I am using jupyter.

Also it becomes easier to monitor with jupyter-lab

IPython has %xmode magic that adds more context to stack traces.

Here is an example. Let’s create ZeroDivisionError by making nested function calls:

def f1(x, y):
    z1 = x*y
    z2 = x/y + z1
    return z2
def f2(a, b):
    c1 = a**2
    c2 = f1(a, b) + c1
    return c2
f2(42, 0)

%xmode plain reverts to a really simple, standard Python traceback:

Traceback (most recent call last):

  File "<ipython-input-175-58764fec4b78>", line 1, in <module>
    f2(42, 0)

  File "<ipython-input-173-52549b1a98b6>", line 7, in f2
    c2 = f1(a, b) + c1

  File "<ipython-input-173-52549b1a98b6>", line 3, in f1
    z2 = x/y + z1

ZeroDivisionError: division by zero

%xmode context (the IPython default) also shows some source context around the lines in the call stack:

---------------------------------------------------------------------------
ZeroDivisionError                         Traceback (most recent call last)
<ipython-input-177-58764fec4b78> in <module>()
----> 1 f2(42, 0)

<ipython-input-173-52549b1a98b6> in f2(a, b)
      5 def f2(a, b):
      6     c1 = a**2
----> 7     c2 = f1(a, b) + c1
      8     return c2

<ipython-input-173-52549b1a98b6> in f1(x, y)
      1 def f1(x, y):
      2     z1 = x*y
----> 3     z2 = x/y + z1
      4     return z2
      5 def f2(a, b):

ZeroDivisionError: division by zero

Finally, %xmode verbose shows context and also values of the variables that are used in evaluation of an exceptionous expression:

---------------------------------------------------------------------------
ZeroDivisionError                         Traceback (most recent call last)
<ipython-input-179-58764fec4b78> in <module>()
----> 1 f2(42, 0)
        global f2 = <function f2 at 0x7feca605b158>

<ipython-input-173-52549b1a98b6> in f2(a=42, b=0)
      5 def f2(a, b):
      6     c1 = a**2
----> 7     c2 = f1(a, b) + c1
        c2 = undefined
        global f1 = <function f1 at 0x7feca60aa510>
        a = 42
        b = 0
        c1 = 1764
      8     return c2

<ipython-input-173-52549b1a98b6> in f1(x=42, y=0)
      1 def f1(x, y):
      2     z1 = x*y
----> 3     z2 = x/y + z1
        z2 = undefined
        x = 42
        y = 0
        z1 = 0
      4     return z2
      5 def f2(a, b):

ZeroDivisionError: division by zero

The last mode alleviates the need for debugger in some cases: sometimes, you can locate the error just by looking at the variables’ values in the moment when the exception has occured.
21 Likes

Wow! Good tip :slight_smile:

Here is another very handy debug module: https://github.com/zestyping/q

This is copied directly from the README. but watch the video linked at the end. it’s quite handy.

Quick and dirty debugging output for tired programmers.

Install q with pip install -U q .

All output goes to /tmp/q, which you can watch with this shell command:

tail -f /tmp/q

If $TMPDIR is set, the output goes to $TMPDIR/q . Note: Some alternatives to the TMPDIR variable are TEMP, TEMPDIR and TMP

To print the value of foo, insert this into your program:

import q; q(foo)

To print the value of something in the middle of an expression, insert “q()”, “q/”, or “q|”. For example, given this statement:

file.write(prefix + (sep or '').join(items))

… you can print out various values without using any temporary variables:

file.write(prefix + q(sep or '').join(items))  # prints (sep or '')
file.write(q/prefix + (sep or '').join(items))  # prints prefix
file.write(q|prefix + (sep or '').join(items))  # prints the arg to write

To trace a function’s arguments and return value, insert this above the def:

import q
@q

To start an interactive console at any point in your code, call q.d():

import q; q.d()

The following Lightning Talk shows how powerful using q can be.

1 Like