thank you @kashif!!
1 Like
Hi @oguiza, hope you are fine.
Can you suggest me some work for stock-price prediction(or crypto-price prediction).Can it be done using tsai?
And, most importantly, do these models(i.e if someone is really benefitting from it), or it is nearly impossible to make accurate stock-price prediction models?
Thanks…
Hi, hope all of you are fine.
Kindly help me with making the TimeSeries Dataset for Crypto Prices Data(including Open,High,Low,Close,Volume,MarketCap).
Thanks…
Is there any plan to include MultiRocket implementation in tsai?
It is the second best SOTA currently after HIVE.
I can try implementing it. Maybe starting from MiniRocket implementation? Any tips or repos to share anyone?
That’d be great. MiniRocket is a good starting point. You may also take a look at MiniRocketFeaturesPlus and MiniRocketPlus. One of the arguments available is add_lsaz (longest subsequence above zero). This is the feature that scored best in MultiRocket. But there are many other options that can be used with MultiRocket (which makes it more complex too).
Please, feel free to submit a PR with a MultiRocket implementation if you decide to move forward.
Can you tell me how MiniRocket is in sklearn while the library itself is on PyTorch
First of all, great implementation @oguiza, and credits to the people who have contributed to the project. I appreciated the effort.
I was wondering about the idea behind using None in item transformations such as [None, [TSRegression()]] or [None, [Categorize()]]. I can’t truly remember but I might also have seen without None versions of them.
The first tfm in tfms is applied to the X and the 2nd to the y. X usually doesn’t require a transform. That’s why it’s usually None.
1 Like
I started to use tsai library last week and so far so good!
Here are some of the take-aways after a few days of using the library:
- Many thanks to @oguiza!
- In order to use a custom dataset, 15_PatchTST_a_new_transformer_for_LTSF.ipynb was helpful for understanding how to preparing data.
- Combination of continuous and categorical features is not supported (Time series data with a combination of continuous and categorical features · Issue #231 · timeseriesAI/tsai · GitHub). I am not sure if it is not as typical usage for everybody else.
I will keep you guys posted as I familiarize myself with the library better.
1 Like
Hi @hiromi,
It’s great to hear again from you. I’ll always be grateful for the great summaries you created based on Jeremy’s classes ![]()
I am not sure if it is not as typical usage for everybody else.
TBH this is a common use case, and it’s true that it’s not well resolved yet. There aren’t many public datasets that contain this type of data (it’s more often used in forecasting - TFT model for example allows multiple types of input data).
A model I’ve used when needed to use categorical and continuous data is TSiTPlus. It’s a variation of ViT adapted to work with time series.
1 Like
Great! I will certainly give TSiTPlus a try ![]()
I do have a time series beginner question.
I have weather data (historical and forecast) and electricity usage as a target value. Initially, I thought it would be a “forecast” problem but there is an essence of regression because we will have weather forecast data in advance.
For example, if we can look back 5 windows and want to predict the next 5 values while considering the weather forecast data for these future windows that looks something like:
| datetime | temp | usage |
|---|---|---|
| 9/14/2021 6:00 | 24.26 | 0.116701 |
| 9/14/2021 7:00 | 24.21 | 0.109265 |
| 9/14/2021 8:00 | 24.62 | 0.117763 |
| 9/14/2021 9:00 | 25.26 | 0.112717 |
| 9/14/2021 10:00 | 25.21 | 0.125903 |
| 9/14/2021 11:00 | 26.26 | pred[0] |
| 9/14/2021 12:00 | 27.66 | pred[1] |
| 9/14/2021 13:00 | 27.84 | pred[2] |
| 9/14/2021 14:00 | 28.47 | pred[3] |
| 9/14/2021 15:00 | 28.33 | pred[4] |
Is there a trick to structuring the input data?
I tried prepare_forecasting_data which is close but I feel like I am not taking advantage of the weather forecast data that are available.
fcst_history = 5
fcst_horizon = 5
x_vars = ['temp', 'usage']
y_vars = ['usage']
X, y = prepare_forecasting_data(df, fcst_history, fcst_horizon, x_vars=x_vars, y_vars=y_vars)
I also considered a straight regression problem, but that will not take advantage of the recent usage data that is available (and it might indicate things like “they bought an electric car and their general electricity usage is higher”).
Maybe I can do the nested lag feature described here so that I do not have to include the usage column in the input:
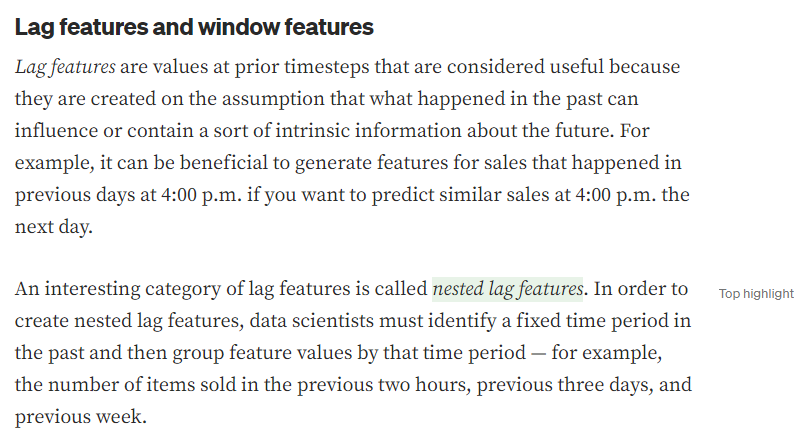
Any suggestions/advices will be much appreciated!
Hi @hiromi,
I’ll give my 2 cents.
There are always multiple ways to tackle a problem. This one looks like a forecasting problem where you have a dependent variable (usage) and some covariates that may have some predictive power.
One issue with your table:
| datetime | temp | usage |
|---|---|---|
| 9/14/2021 6:00 | 24.26 | 0.116701 |
| 9/14/2021 7:00 | 24.21 | 0.109265 |
| 9/14/2021 8:00 | 24.62 | 0.117763 |
| 9/14/2021 9:00 | 25.26 | 0.112717 |
| 9/14/2021 10:00 | 25.21 | 0.125903 |
| 9/14/2021 11:00 | 26.26 | pred[0] |
| 9/14/2021 12:00 | 27.66 | pred[1] |
| 9/14/2021 13:00 | 27.84 | pred[2] |
| 9/14/2021 14:00 | 28.47 | pred[3] |
| 9/14/2021 15:00 | 28.33 | pred[4] |
is that you make the forecast totally dependent on the quality of your forecasted temperature.
An alternative approach you may want to consider if you have historical forecasts is something like this:
| datetime | temp | forecast 1 | forecast 2 | forecast 3 | forecast 4 | forecast 5 | hour | usage |
|---|---|---|---|---|---|---|---|---|
| 14/09/2021 06:00 | 24,26 | 25,11 | 25,84 | 26,47 | 26,69 | 26,76 | 6,00 | 0,116701 |
| 14/09/2021 07:00 | 24,47 | 25,40 | 25,94 | 26,28 | 27,09 | 27,68 | 7,00 | 0,123701 |
| 14/09/2021 08:00 | 24,72 | 25,53 | 25,58 | 26,48 | 26,52 | 26,95 | 8,00 | 0,048701 |
| 14/09/2021 09:00 | 24,79 | 25,68 | 26,47 | 26,81 | 27,19 | 27,56 | 9,00 | -0,045299 |
| 14/09/2021 10:00 | 25,73 | 25,94 | 26,08 | 26,10 | 26,42 | 26,46 | 10,00 | -0,077299 |
| 14/09/2021 11:00 | 26,62 | pred 0 | ||||||
| 14/09/2021 12:00 | 27,53 | pred 1 | ||||||
| 14/09/2021 13:00 | 28,31 | pred 2 | ||||||
| 14/09/2021 14:00 | 28,93 | pred 3 | ||||||
| 14/09/2021 15:00 | 29,91 | pred 4 |
At each row, you basically add anything that is known at that point. Based on that you predict the next 5 usage columns. I believe this might allow the model to learn about the accuracy of the forecast at each step.
You may also want to add other columns to use date-related features (day of the week, day of the month, hour, etc). Rolling and lagging features are also commonly used. For example, you could add a column with the rolling mean of the last 24 steps.
1 Like
Thank you so much for taking the time to explain!! Yes, I was planning on adding date_parts as features, but I didn’t even think of adding “everything I know at this point” as columns. I will also give rolling mean a try and see which ones work well.
It is a great point that my initial idea was very reliant on the accuracy of the weather forecast.
Your suggestions gave me a lot to think about and many ideas, and I very much appreciate it! ![]()
1 Like