TimeSeries

Regarding big datasets, pandas+ dask is very simple, I had with experience working with dask.
May be a little old, but this pandas tutorial is one of the best available: https://tomaugspurger.github.io/modern-8-scaling

1 Like

Hi guys, this is a really practical development. I have never used weka or arff before. How do you guys convert a csv to arff with time sequence. for example: I have 4 time series and a label. I want it to include 7 days of its previous value. The shape should be (n, 4, 7). Did you guys do it in weka? I can’t find the method online. Thanks a lot!

Small performance update. In my case cast in TensorBase.__new__ was very slow. Ether make a _before_cast function or make an entire __new__ for your custom class. This speeded my loader by a factor 3.

3 Likes

Hi,

I’ve created a new repo (timeseriesAI2) to share my view on how time series classification could be done in fastai2 based on the following high level requirements:

  • Be able to work with both univariate or multivariate time series
  • Data may be larger than RAM, so it may be in memory or on disk.
  • Use data on disk with similar performance to data in memory.
  • Data is often split into X (inputs) and y (label), or less often into X_train, X_valid, y_train, y_valid
  • Add test dataset .
  • Add an unlabeled dataset (for example for semi-supervised/ self-supervised learning).

Based on this I’ve tested different options and have found a way to meet all requirements above. It uses numpy arrays of np.memmap subclass.

If you are not familiar with them (I wasn’t until a couple weeks ago) you can check tutorial nb 00. It shows a way to work with arrays larger than your RAM keeping data on disk.

nb 01 shows how you can perform time series classification using numpy arrays.

PS I’m sorry about the delay in creating the notebook, but the first week of confinement at home with the children hasn’t been easy :slight_smile:

7 Likes

@oguiza, I checked out your repo and it’s great. I was pleasantly surprised that you used some of my building blocks, and that our 2 core.py file share many similarity, it helped me understanding your implementation more quickly. I also liked the features you added. It proves that It’s better to iterate on each other implementations. The four of us can bring different insights on the shared topic and therefore optimize both our time and our source code.

I like your 00_ tutorial notebook about np.memmap , and the fact it is thorough detailed. You have some good material for a blog post.

As a friendly revenge, I will check what features I can borrow from your package, and I will reimburse you next week when I will push some new stuff I’m presently working on, and that some people, following this thread, might be interested in using.

Looking forward to shaping up together the common package.

1 Like

I’m very excited to share with you a new feature for the timeseries package that enables displaying Class Activation Maps for time series. It offers both CAM and GRAD-CAM as well as user-defined CAM. The InceptionTime model is used as an illustration.

At the heart of this feature, there is one single method called show_cam() that you need to use . The latter accepts the following data:
- A Single dataset item
- A list of dataset items that a user select
- A batch of items returned by one_batch() method

I also exposed most of the methods used under the hood that might be useful for others.

@jeremy and @sgugger, I think you will be happy to know that implementing both and GRAD-CAM was the easiest part of the whole implementation thanks to the notebooks that you put out there and that you keep updating and adding new ones. Those notebooks are invaluable. Thank you for sharing them. Figuring out how to plot multi-colored curves using matplotlib was by far the toughest part.

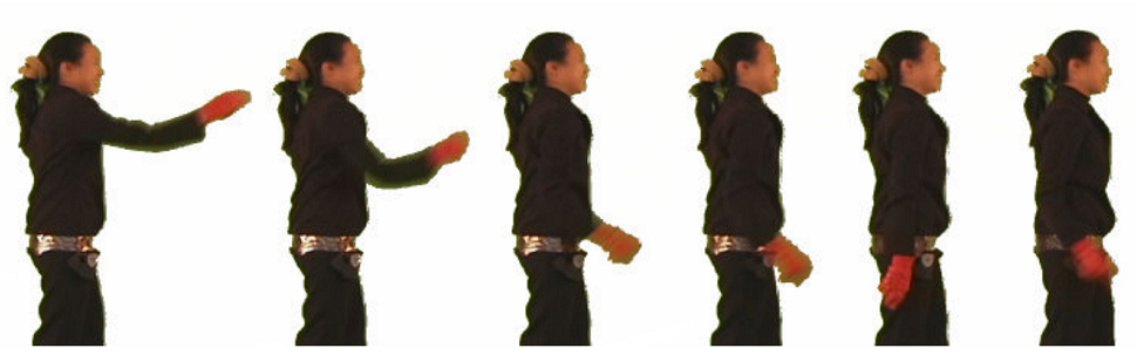
As an illustration of the capabilities of this new feature, I choose one of the UCR univariate time series datasets called GunPoint. This is the dataset used in may articles for both CAM illustration like in the excellent review that @hfawaz wrote and Shapelet Transform. This dataset involves one female actor and one male actor making a motion with their hand. The two classes are: Gun-Draw and Point. I added another notebook to illustrate an example of ECG classification (Normal heartbeat and a Myocardial Infarction) using the ECG200 dataset.

Here below, an example on how to call show_cam() (if we want to use CAM, adding func_cam=cam_acts i unnecessary because it is the default function):
show_cam(batch, model, layer=5, i2o=i2o) or
show_cam(batch, model, layer=5, i2o=i2o, func_cam=cam_acts) # CAM is the default option

GRAD-CAM option:
show_cam(batch, model, layer=5, i2o=i2o, func_cam=grad_cam_acts) # GRAD-CAM

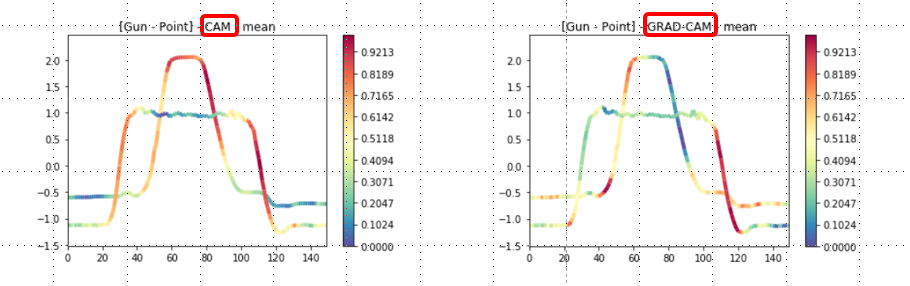
This illustrates the Gun vs Point activations. Activations curves are displayed for both CAM and GRAD-CAM.

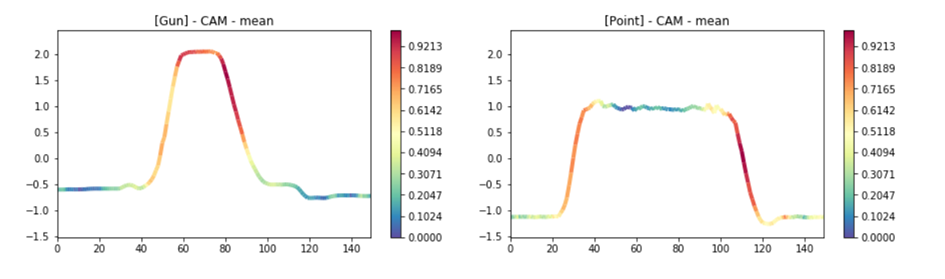
Activations curves can be also displayed separately. This illustrates the Gun vs Point using CAM function.

The show_cam() method is highly configurable with several default settings. Here below is the show_cam() full signature:

show_cam(batch, model, layer=5, func_cam='cam_acts', reduction='mean', force_scale=True, scale_range=(0, 1), cmap='Spectral_r', linewidth=4, linestyles='solid', alpha=1.0, scatter=False, i2o='noop', figsize=None, multi_fig=False, linewidths=None, colors=None, antialiaseds=None, offsets=None, transOffset=None, norm=None, pickradius=5, zorder=2, facecolors='none')

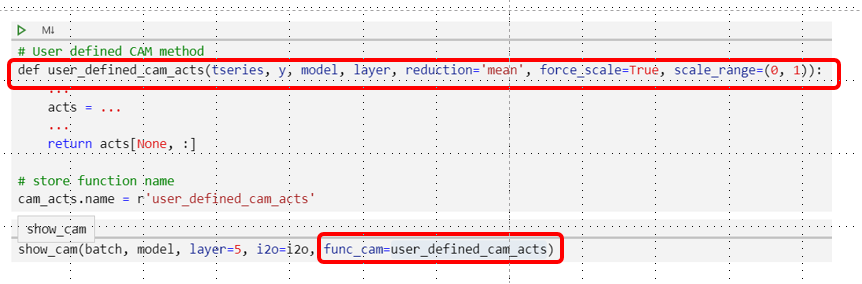
One of the options that I’m excited about is the possibility that the users have to plug-in their own custom CAM method. Check out both cam_acts and grad_cam_acts to see how easy you can create your own CAM function.


When CAM and GRAD-CAM are calculated, the resulting tensor has a shape of (n_channels, seq_length) and therefore has to be reduced to a tensor with (1, seq_length) shape in order to be superimposed on the original time series [the latter has a (1, seq_length) shape] . show_cam() offers 4 types of reductions: mean (default), median, max, mean_max. Here below, the max reduction is chosen.

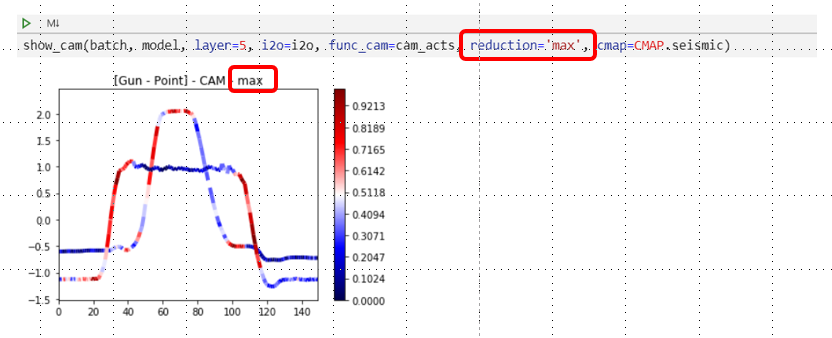
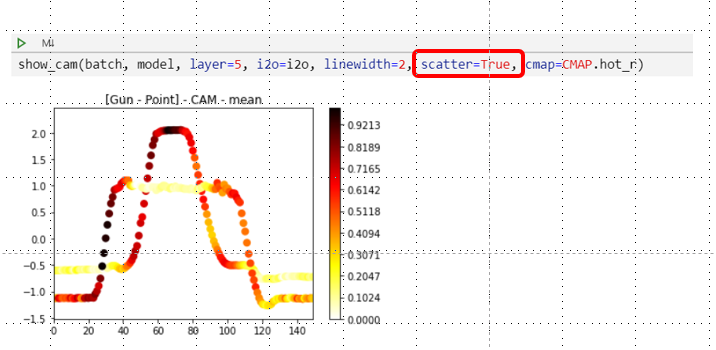
Scatter plots are also supported:

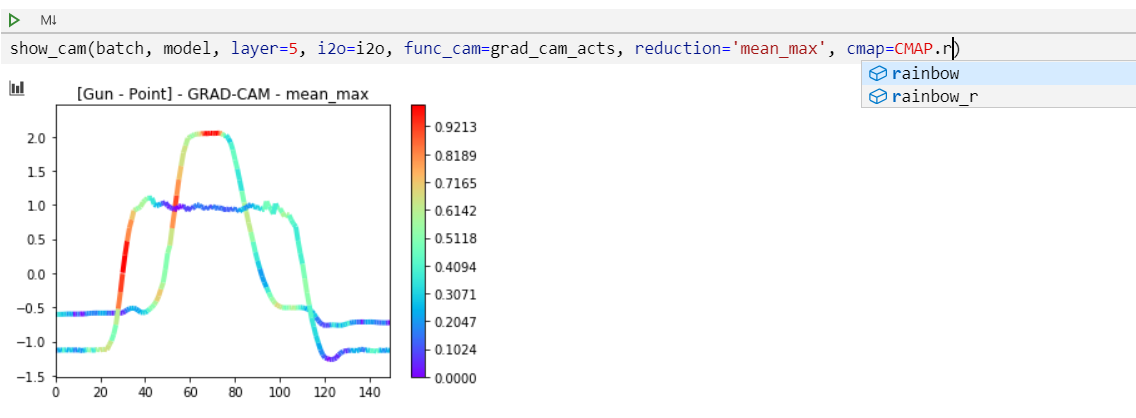
As illustrated here below, the user is able to choose one of the 164 cmap palettes offered by show_cam(). I added a class called CMAP that helps autocompletion as seen in the following figure (no need to remember cmap names):

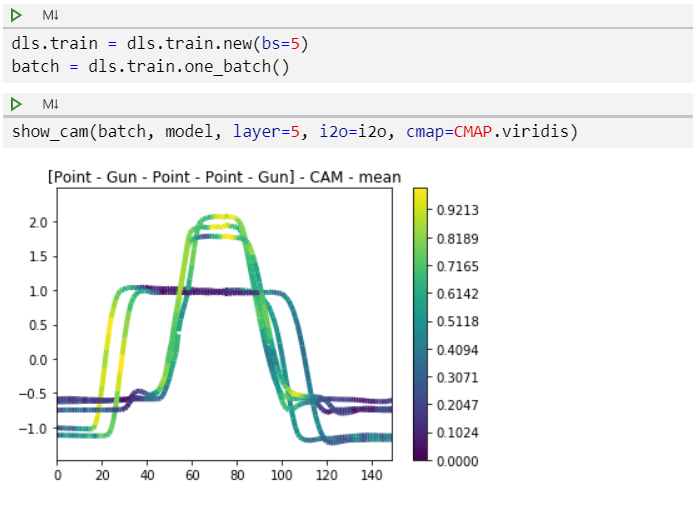
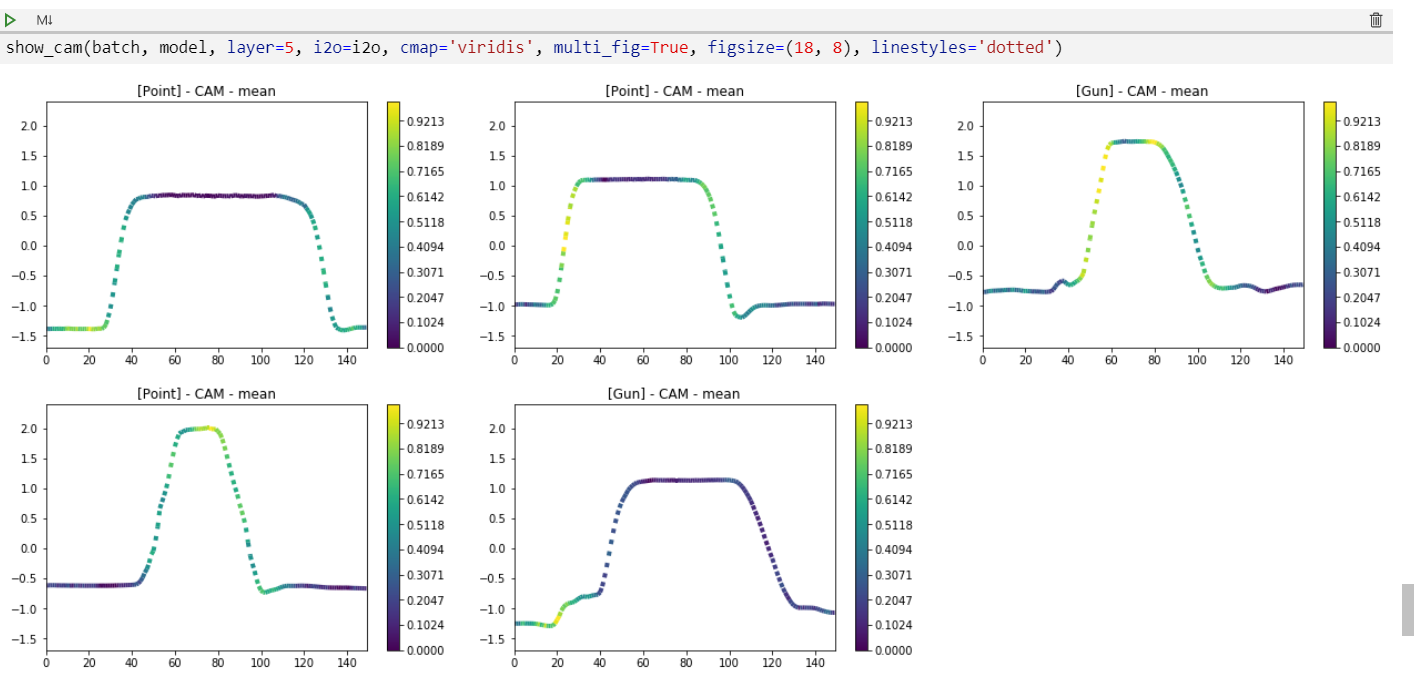
show_cam() can also plot activations of a whole batch of time series (example with batch size of 5 here below)


We can also display the same curves in separate figures in order to ease their interpretation:

This is just a glimpse of the different capabilities found in this CAM feature. For those interested in this stuff, I invite them to check out the detailed documentation as well as checking out these notebooks: 82_univariate_timeseries_CAM.ipynb, cam_tutorial_GunPoint.ipynb, and cam_tutorial_ECG200.ipynb

If you have access to some interesting time series datasets and/or any implementation of other CAM methods (other than CAM and GRAD-CAM), please consider sharing them in this thread.

Please give this feature a try and share your feedback. If you find it interesting, please share it and/or like it on GitHub.

12 Likes

Hi farid hope you are having a splendid day!

This looks excellent.

Cheers mrfabulous1 :smiley: :smiley:

1 Like

Hi all! This is Sean Law, the creator of STUMPY (for computing matrix profiles from times series data). Feel free to file an issue and let me know how I can help. I am looking forward to seeing what y’all do with STUMPY!

6 Likes

I’ve just shared the version of the TimeseriesAI repo I’ve ported to v2.
TimeseriesAI is a DL package for Time Series / Sequential Data library based on fastai.

The package be be installed from pip: pip install tsai

In different tests I’ve run it’s 40-60% faster than vanilla v2 when using numpy arrays.

If you are interested, you have more details here:

7 Likes

Super!

Hi @seanlaw, welcome to the forum! :grinning:
Thanks for sharing your package. It’s great to learn about different approaches to time series. I’ve scanned through the documentation (very nice!) and have read about TS matrix profiles. I wasn’t aware of this concept.
I’d like to ask you something. I usually work with TS where the input has 3 dimensions (n samples, n variables, length) instead of a single, long time series. Can matrix profiles be applied in this case? If so, do you have a worked example where I can see how it can be applied?

2 Likes

@oguiza There is a multidimensional version of the matrix profile for motif discovery that you can read more about here. In STUMPY, it is called stumpy.mstump (rather than mSTOMP in the paper) and you can see a work-in-progress Jupyter notebook here, which tries to reproduce the result of Figure 4 from the paper.

Please note that working with multidimensional time series is quite computationally expensive in general so beware of the curse(s) of dimensionality. STUMPY also offers a multi-server distributed version of stumpy.mstump called, appropriately, stumpy.mstumped but it requires setting up a distributed Dask cluster and pointing STUMPY to your Dask distributed client. Your feedback is welcome!

2 Likes

@oguiza Also, I see that you are leveraging Google Colab, STUMPY also currently supports 1-dimensional matrix profile computation on GPUs via stumpy.gpu_stump and you can even run it directly on Colab GPUs. See this example here and check out the documentation here.

GPU support for multi-dimensional time series is not available yet but we hope to add it in the future. Happy matrix profiling!

2 Likes

Hi! I have a hopefully quick question:

Problem setup: I need to take a tensor with shape BS x 1 x Features (where BS is batch size) and put it as an input to a LSTM with TS timestamps. So transform it to BS x TS x Feat. However, I need the gradients to be backpropagated! Afaik I need sth similar to TimeDistributed from keras.

What I tried is to use tensor.expand(): Expanding a tensor does not allocate new memory, but only creates a new view on the existing tensor ...
With expand(), the model learns, but well, maybe because the data is fairly easy.

Does expand() also broadcasts my gradients? Sums them up for each TS? Is there a better approach? The repeat() method copies the data, according to the doc. The model works with repeat too, so, I can’t really tell what’s going on.

Also, because it is never that easy. I also add a feature vector of size BS x TS x 1 at the end of the initial feature vector, for each TS.

Thank you!

p.s. What I am trying to do is a simple encoder/decoder architecture for time series. No attention, but I do have some additional info available about the “future” that I want to inject.

Hi @visoft,
I’m sorry but I’ve been unable to understand exactly what you want.
You say you have a tensor of shape: bs, 1, features. But is this a sequence?
In time series/ sequence problems you usually have an input shape = (batch size, features, seq_len), where features may be 1 for univariate TS or >1 for multivariate TS, and seq_len is the lenght of the time series (steps).
So based on what you say, it seems you only have a single time step. I think I’m missing something :thinking:

LE: Answer:
Well, I found the answer on pytorch forum. Basically both repeat() and expand() behave the same wrt to backpropagation:

Original question:

I am trying to reimplement these: https://machinelearningmastery.com/how-to-develop-lstm-models-for-multi-step-time-series-forecasting-of-household-power-consumption/

The chapter: Encoder-Decoder LSTM Model With [Univariate] Input. Key reading for my problem “First, the internal representation of the input sequence is repeated multiple times, once for each time step in the output sequence. This sequence of vectors will be presented to the LSTM decoder.”

The output of the encoder is bs x 1 x feature (basically the last output of LSTM) This is then “broadcasted” time-wise to the length of the desired output (and fed to decoder LSTM)

And they do in Keras (comments are mine):

# Encoder, take only the last output
model.add(LSTM(200, activation='relu', input_shape=(n_timesteps, n_features))) 
# Does it "broadcasts" gradients too? Probably! In Keras
model.add(RepeatVector(n_outputs))
# The decoder, with n_outputs time steps
model.add(LSTM(200, activation='relu', return_sequences=True))

What I do:

__init__
   ...
   self.lstm_enc = nn.LSTM(input_size=in_features, hidden_size=hidden_size, batch_first=True)
   self.lstm_dec = nn.LSTM(input_size=self.hidden_size, hidden_size=hidden_size, batch_first=True)

forward()
   ...  
   #bs = batch size
   lstm_enc_out,_ = self.lstm_enc(bn) # bn tensor have BS x some time length x some features
   last_lstm_output = lstm_enc_out[:,-1,:]
   last_lstm_output = last_lstm_output.view(bs, 1, -1) # BS x one timestamp x some features
   last_lstm_rep = last_lstm_output.expand(bs, self.future_steps, self.hidden_size) # !!!!!
   decoded_lstm,_ = self.lstm_dec(last_lstm_rep)
   ...

Now, the model I am implementing is just an exercise, but the gradient issue is bugging me!
L.E: In original post, it is not about Keras’ TimeDistributed but RepeatVector. My bad.

I have been playing lately with image sequences, trying to predict the iiradiance from the sun.
It is pretty hard to train these models, and have been wondering if the AWD_LSTM may work for this type of continuous task.
My problem is to predict the future steps of a continuous time series that has one image, and some quantities for the past values.
image
I am using N images from the past (20 for this experiment) and I try to predict the next 15 minutes.
So in blue, is the x, and in red the y.
The images that are plotted, represent the 1st, the middle and last image, just to get an idea if it is cloudy or not.
As you can imagine, the trick is to predict if the clouds will cover the sun in the next frames.

My base model, is very similar to the one on the repo I posted some days ago with and encoder based on the dilated resnet from @muellerzr and some LSTM layers to capture the temporal relation.
I have a lot of data, like millions of images, from different sites in very high quality. Currently trying to work with 400 days of data (1 image/minute) to test and find a suitable model.
The papers on this topic are pretty useless, with very blurry results, and with codes that are far from best practices. I have implemented a handful of them, with results that are weak.
Any ideas?

1 Like

I don’t get your problem. You just need to format your data on the correct input shape, make the batches be:

[bs, seq_len, features]

and the nn.LSTM(features, hidden_dim) will return a tensor of shape: [bs, seq_len, hidden_dim] no need to repeat or expand.

So your model would be:

class Model(Module):
  def __init__(self, input_size, hidden_dim):
     self.lstm_enc = nn.LSTM(in_features, hidden_size, batch_first=True)
     self.lstm_dec = nn.LSTM(hidden_size, hidden_size, batch_first=True)
  def forward(self, x):
    x = self.lstm_enc(x)
    return self.lstm_dec(x)

So,

model = Model(16, 32)
model(torch.rand(8, 10, 16)).shape
>>[8,10,32]
2 Likes

Hi, that’s a really interesting problem! I am also starting to work in a project about deep learning and space weather. Currently we are using N-beats as an architecture for the forecasting of the solar flux (for now just univariate forecasting).

Unfortunately I cannot help you because I think you are making kind of a multimodal learner with both images and time series as input, is that correct? However, I would like to know more about the sources of data that you are using, in case they are publicly available. Is there anywhere that I can see more of this work?

Thank you so much!

Thank you for the answer. What is not said is that I want to decouple encoder from decoder because input and output have different length (not a problem per se) and I have some prior info about the future that I want to append to the output of the encoder. Otherwise, yes, lstm_dec(lstm_enc(input)) would do the trick just fine. Also, encoder will be a CNN or other fancy architectures.