That makes sense, yes! The sets in my test data are all new, so there are no repeated set labels. Still, your proposal gave me some new ideas I’d like to try out, so thanks again!
1 Like
Thanks for posting, @harikrishnanrajeev. I checked out the paper above because it is of personal interest. I have no job income, and with most of my savings in stocks, I pray that savings will last longer than my remaining life. (This is in the USA, where we do not take care of retirees, and realize that many other countries have less of a safety net.) I have wanted some sort of “automatic” investing system for a long time, to remove some of the life-consequential effort and stress of deciding when to buy and sell. I have also been playing around with applying transformers to time series, and hoped the paper would provide some good ideas.
But, after a quick read, I am not at all sure that this paper offers anything. I hate to dismiss someone else’s sincere work, so I hope that someone here will check my conclusions. Here are the main points:
-
Looking at Figures 14 and 15, the predictions on the validation set, I see that the predicted close is near to the actual close shifted one day to the right. This is the same failure to predict I see when running my own code! Their model is fundamentally predicting that tomorrow’s close will be today’s close. It tracks trends a bit better, but fails to predict reversals. This is a failure that anyone who has actual experience trading or investing would notice immediately.
-
The authors state “The applicability and usefulness of our model to fintech are demonstrated by its ability to predict closing prices with a probability above 90%.”
AFAICT, their accuracy measure is the mean of the percentage between prediction and actual, which they call “MAPE”. This has nothing to do with probability or prediction. It only means that the prediction is on average within 10% of the actual. MAPE can serve as a loss function, but it is not a useful accuracy measure. -
The authors compare the 90% above with the 72% found by Gudelek et al.
https://www.researchgate.net/profile/Ugur-Gudelek-2/publication/323131323_A_deep_learning_based_stock_trading_model_with_2-D_CNN_trend_detection/links/5b3641b84585150d23e1b3df/A-deep-learning-based-stock-trading-model-with-2-D-CNN-trend-detection.pdf
But that paper’s 72% is a completely different measure of accuracy. In that paper, they say whether a predicted close will be up vs. down, and the accuracy is the percentage of right answers. (A reasonable measure of accuracy, IMO.) The 72% and the 90% are calculated by completely different methods and therefore are not even remotely comparable.
-
Jeremy has advised making a baseline model to see if the ML approach adds anything. For example with MNIST, we use the dot product of a test image with the average of all training 7’s to get a score for that image. For stock price prediction, a reasonable baseline model would be to predict today’s price for tomorrow (perhaps with some naive trend following). It would be interesting to see whether the authors’ model and validation measure would do any better than this simple prediction algorithm.
-
Smaller quibble with Table 1. SUMMARY OF RELATED WORKS: “We have kept the content in the table to the minimum due to the space issue, please refer to the listed works for details.”
The “Accuracy” column is a mish-mash of MSE, RMSE, percentages, and an unlabeled number. There is no effort made to compare the performance of the authors’ model with the results of previous work.
So that’s my quick analysis of the paper. I never got as far as looking at their implementation of transformers. There may be somthing very valuable in it. I only saw that the method does not work for stock price prediction and moved on.
I would love it if someone would check my conclusions. Any comments and corrections are welcome!
Malcolm
![]()
Hello people,
I have been using tsai at my workplace which has yielded in very promising results. I had a few questions about the entire API.
- What is the difference between TSRegressor and TSForecaster? Their source looks quite similar to me.
- In order to predict say
n timestepsin the future, I have to write a custom function which would make a prediction, then I would use that prediction to make the next prediction and so on. Is there a direct function in the API that would allow that? (dartshas such options in the API which allow the same functionality)
Also, @oguiza thanks for creating tsai!!
Using tsai, what would be the best way of transforming the X,y generated from a SlidingWindowPanel function back to a dataframe? For example, predicting on the validation set and merging that back with the initial dataframe for error analysis.
@oguiza ,
FiLM: Frequency improved Legendre Memory Model for Long-term Time Series Forecasting [2205.08897] FiLM: Frequency improved Legendre Memory Model for Long-term Time Series Forecasting
In long-term forecasting, FiLM achieves SOTA, with a 19% relative improvement on six benchmarks, covering five practical applications: energy, traffic, economics, weather and disease.
Cool stuff, thanks!
Hello people, I’m using tsai to make predictions on a dataset and I can’t figure out the reason behind the output of the model.
If you take a look at the image below, the output of the predicted model keeps getting flattened out. What could be the reason behind this? Is it the loss function? or the architecture?
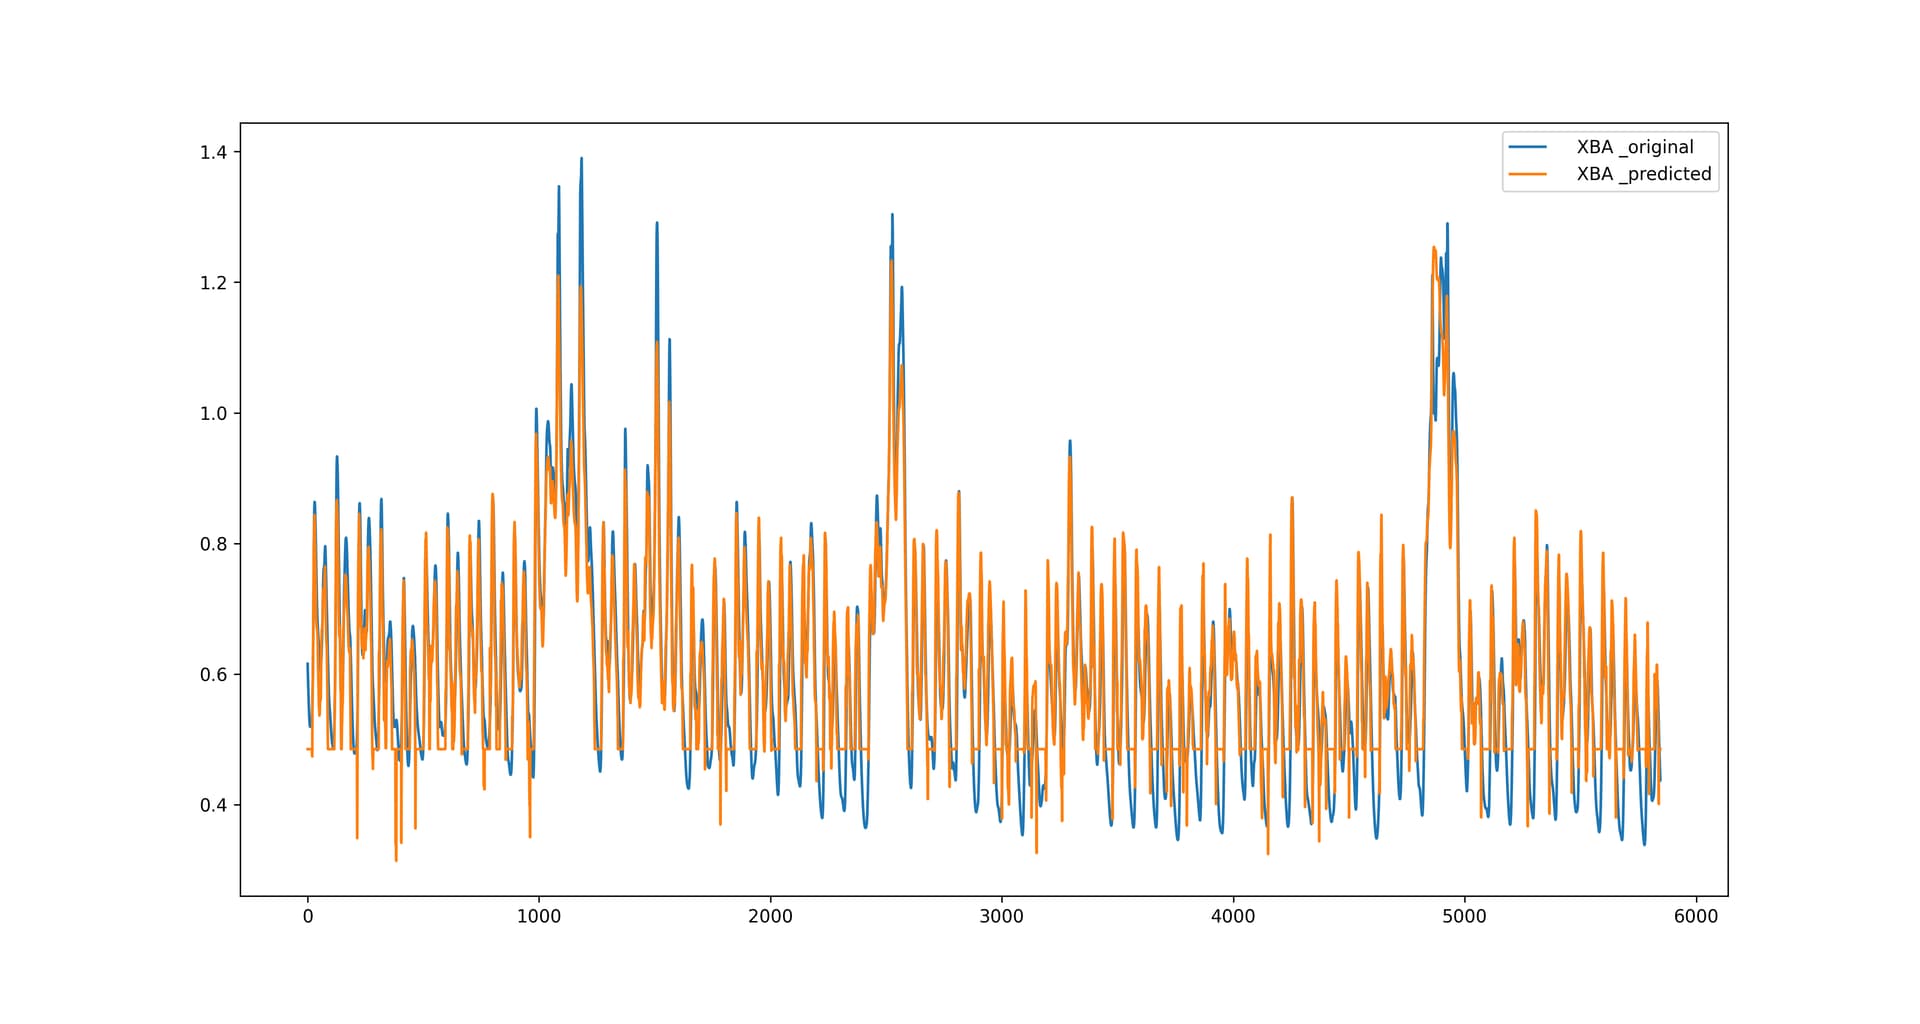
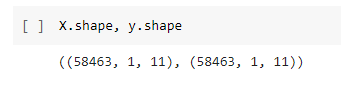
Here is the code and the shapes of the inputs
batch_tfms = [TSStandardize(by_sample=True)]
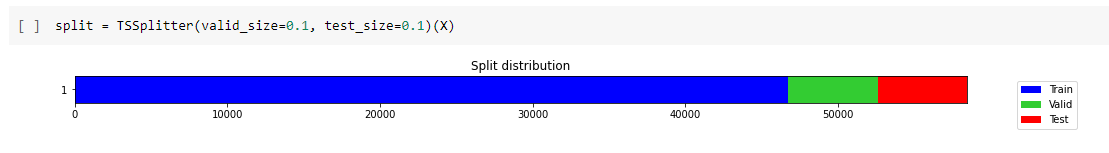
learn = TSRegressor(X, y, batch_tfms=batch_tfms, splits=split,
arch=InceptionTimePlus, metrics=mae, bs=params['bs'], train_metrics=True)
lr = learn.lr_find()
learn.fine_tune(100, lr[0])
@oguiza thanks for the library, btw!
hey there hope you are doing good
I’m using tsai and I like it very much but I wonder if I can tune the hyperparameters in the models and also if i can use the model architectures in other libraries like keras.
thanks
Have you seen this notebook on hyperparameter tuning @george23 ?
2 Likes
@oguiza , it might be of interest. Where do you communicate for tsai recently by the way?
Greetings everyone,
I am currently working on a problem of classifying the condition of machines based on their time series vibration signals. The data I have varies in shape because each machine, such as pumps, turbines, etc., has a different number of vibration signals measured for it, leading to a different number of variables.
My question is whether I should create a single model that can handle all machines or create separate models for each machine category. Additionally, considering that pump machines comprise most of the machines in the dataset, would it be appropriate to create a single model for all machines?
Thank you for your help!
Here’s a tweet I’ve released today. I saw the paper some time ago and have integrated it into tsai. ![]()
1 Like
Hi @george23,
In the type of tasks you are describing I always try to develop a single model for all categories. It may be useful to add some type of encoding to pass the category to the model (on-hot if there are not too many classes or categorical encoding).
1 Like
hi, @oguiza thanks for the response.
if I trained a single model for each category why I would need to pass the category to the model?
also, is there a way to combine the single models for each category after training to have a model like that that can be generalized to that categories?
thanks for your help!
I said I try to develop a single model for ALL categories (multiclass), not for EACH class (binary).
1 Like
that’s great,
but is it possible to do that in the library as my machine categories have different numbers of variables, eg some have 8 variables and others have 4 variables so the input data is not consistent?
thanks for your time!
How would one do this for multivariate? Stack as channels like rgb maybe?
Yep, I saw when I updated. Thanks for the great lib.
can you told me please how to train a model if my dataset have different number of variables?
sorry for being bothering, but I really love the library and want to use it on my project.
thanks!