Time series/ sequential data study group

This looks interesting. The two “augmentation” methods I have seen used most in kaggle competitions are

  • augmenting by adding gaussian noise
  • dropping a percentage of the original measurements (kind of like input dropout)

And I just realized it might be an interesting method to randomly drop a certain percentage of timesteps and then close those gaps with potentially different forms of interpolation / missing data treatment. That way there should be changes that kind of stay consistent with the acutal series, but change it in small ways. Maybe combined with a little noise? Never tried that though…

The two recent competitions you might want to search the top 10 solutions for these kinds of things are the PLASTiCC and the VSB Power Lines ones, but there are older ones that also might have interesting stuff… Both were for classification, not forecasting though.

Does anyone have a Timeseries forecasting notebook using RNNs?
I am trying to reproduce the lesson 7 notebook (human-numbers) with Time series data but I am having a hard time.
https://machinelearningmastery.com/how-to-develop-lstm-models-for-time-series-forecasting/
I am trying to reproduce this trivial examples in pytorch/fastai and I am failing miserably…
Basically, make an RNN to predict a linear regression…
Any hints?

1 Like

@marcmuc

When reading the paper corresponding to the wearable data augmentation stuff, it struck me that the most effective methods were identical or very similar to what is used in image augmentation. Int he published benchmark, the authors were able to boost classification accuracy by up to 10%. I hope to test that out next week as to see how it works on my time series data.

Adding Gaussian noise is certainly a best practice worth measuring. I think input dropping is already done implicitly in fast.ai whenever you use regulation.

That said, I already have ~15 more experiments on my bucket list so I hope to get some results next week. In case something interesting pops up, I share an update.

What a shame that he earns a lot star on github and medium’s attention by fooling others in this way…

1 Like

Hi All!
i am very new here so sorry if I ask basic things. I am attempting to apply the image transformations to time series as showed by @oguiza back at the beginning og this thread. I had my hard times in realizing the the pyts libray is now in rev 0.80 and the GASF, GADF, MTF, RecurrencePlots classes have been renamed. Some have been suppressed.
OK, rolling back to 0.70 it is much better, but still I cannot run properly the MTF tranformation.
Executing the cell with

mtf = MTF(64)
X_mtf = mtf.fit_transform(X_train)

in the gist I get an error

~\AppData\Local\conda\conda\envs\pyts\lib\site-packages\pyts\image\image.py in _mtf(self, binned_ts, ts_size, image_size, n_bins, overlapping, window_size, remainder)
    334                 for j in range(image_size):
    335                     AMTF[i, j] = MTF[np.arange(start[i], end[i]),
--> 336                                      np.arange(start[j], end[j])].mean()
    337 
    338             return AMTF

IndexError: shape mismatch: indexing arrays could not be broadcast together with shapes (15,) (16,) 

Looks like there is some rounding somewhere in the library and one index which should be sqrt(64) becomes 15.
I can bring on my investigation skipping the MTF transformation, still this is pretty annoying!
Any hint?

Thank you for the excellent post @oguiza
Here is an examples for (1):

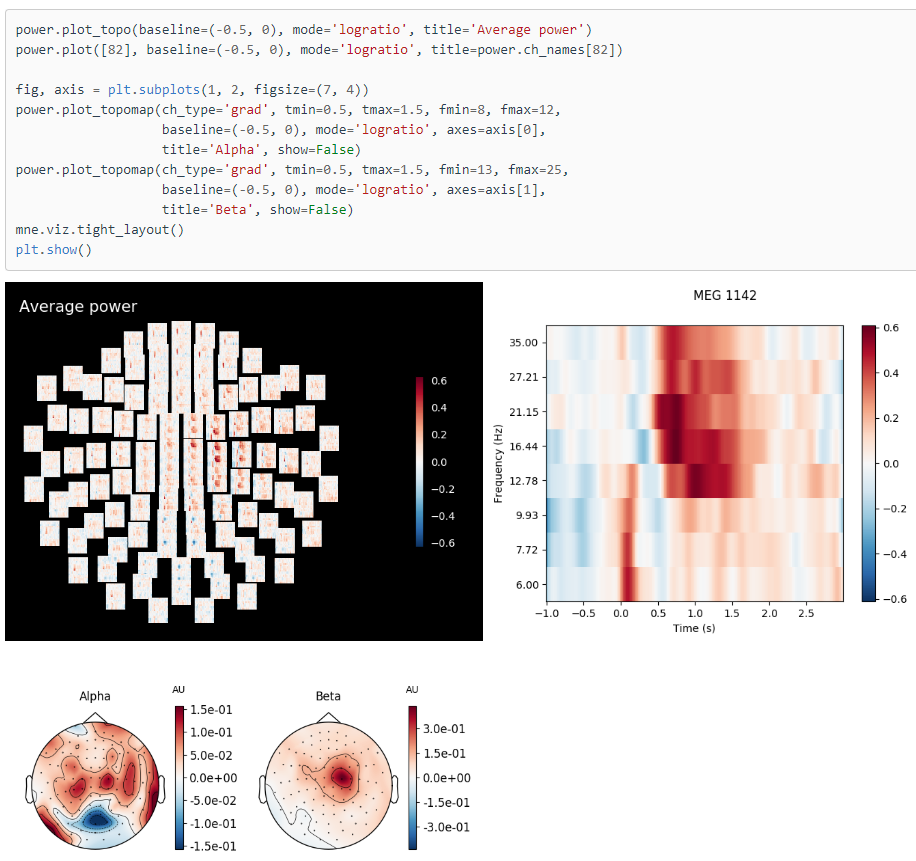
  1. This is something I am working one. Multiple EEG sensors on the scalp. So this is an example of multi-variate time series (each electrode position will pick up a signal that we are interested in its spectrograms, so we have 64 spectrograms). Have a look into the image with the black background :

I add to your list:
4. Concatenating multi CNN outputs (each CNN for each uni-variate spectrogram) into single dense NN like this:

1 Like

Hi @marcello_m,
I’ve checked the updated pyts library and it seems to me that all the functionality to transform time series into images is still there. They’ve modified the API though, so you can still get access to all 4 image transformations I used in the gist. They actually have examples of how the new functionality works here. I don’t have time to update the gist right now, but I’m planning to create some notebooks to demonstrate the different alternatives in the next few weeks.
In any case, I’d recommend you update to the latest version and follow the examples to update your copy of the gist.
Please, let me know if you can make it work or find another issue.

2 Likes

Hi everyone, really glad to have found this group. I am working on developing a model that can forecast (1 or more time steps) using varied time steps in the past (e.g. 64,128,256) and multivariate inputs using CNN. The results are rather good but I was looking into ways to make it better. Has anyone tried time series forecasting using the MTF,recurrence plots, or GAF (e.g. using the pyts library) and can share their experiences/results/wisdom? It seems that most reported results I have seen have been on using pyts for classification rather than forecasting.

Wow, this is really interesting! Thanks for sharing @hwasiti!

I’d have some comments/ questions on this:

  • Are you using a public dataset or proprietary data?
  • What level of performance (accuracy?) do you get with this approach?
  • Have you compared this approach (time series to image transformation) to the more standard time series as array approach (using FCN, ResNet, etc)?
  • Which of the images above do you use as input into the nn?

Absolutely! I missed this approach which I think makes a lot of sense. I’ll add it to my previous response for completion and will create a link to your post. Thanks for adding this alternative!

Hi @fuelnow,
I have not used the time series to image approach for forecasting, but think it should also work.
I don’t know if anybody else has tested it, but it’ll be great if you try it and share your experience!

yeah, i can post some of my findings here! Has anyone received this error while using the pyts package (specifically MarkovTransitionField) before?
/usr/local/lib/python3.6/dist-packages/pyts/preprocessing/discretizer.py:148: UserWarning: Some quantiles are equal. The number of bins will be smaller for sample [ 0 2 6 9 10 14 17 18 22 30 31 35 42 44
50 52 54 56 58 59 61 63 66 70 78 79 80 82
85 89 97 99 100 101 102 107 109 111 113 114 115 119
125 128 132 135 141 143 147 152 154 161 164 166 170 183
193 195 197 198 211 213 220 225 228 230 234 242 247 251
252 259 260 261 263 264 275 277 284 285 287 300 305 310
313 326 328 329 330 331 332 333 337 340 348 349 351 352
353 358 361 363 364 374 377 378 379 387 390 393 401 405
406 407 408 409 410 413 414 419 423 424 426 428 433 439
442 446 447 449 450 455 456 461 463 465 469 475 478 483
490 491 492 495 500 505 506 511 514 515 522 532 534 535
544 547 548 550 553 564 566 567 569 574 577 579 583 585
590 594 596 597 598 602 603 610 611 613 615 616 618 619
620 626 629 633 644 645 646 648 650 651 652 659 661 665
667 668 670 676 679 681 684 688 690 691 695 716 718 719
721 725 739 740 744 750 753 754 757 760 763 765 770 771
777 778 780 784 790 791 794 800 805 808 809 810 813 818
838 846 854 855 860 863 871 872 874 884 886 889 893 896
903 906 909 911 917 922 928 929 930 932 938 940 946 951
953 954 955 957 961 962 965 966 972 975 976 978 981 983
984 988 992 999 1000 1002 1005 1009 1010 1011 1012 1014 1020 1028
1032 1036 1042 1043 1046 1047 1051 1060 1066 1073 1074 1075 1090 1098
1103 1106 1107 1108 1113 1114 1118 1121 1125 1134 1140 1141 1144 1145
1146 1152 1153 1154 1158 1160 1166 1167 1170 1171 1172 1173 1174 1179
1181 1187 1192 1198 1202 1207 1211 1212 1222 1223 1229 1233 1236 1247
1249 1251 1253 1259 1261 1265 1266 1273 1277 1281 1285 1287 1291 1293
1298 1299 1306 1313 1315 1316 1320 1333 1336 1338 1342 1345 1347 1351
1355 1358 1359 1362 1369 1371 1372 1376 1377 1378 1385 1386 1390 1393
1395 1398 1399 1400 1401 1404 1405 1409 1415 1418 1423 1424 1425 1429
1434 1437 1438 1444 1456 1458 1462 1464 1466 1467 1471 1473 1476 1481
1485 1486 1487 1495 1497]. Consider decreasing the number of bins or removing these samples.
“of bins or removing these samples.”.format(samples))

Yes, I’ve experienced something similar in the past.
Here’s how MTF works:

Markov Transition Field (MTF): the outline of the algorithm is to first quantize a time series using SAX, then to compute the Markov transition matrix (the quantized time series is seen as a Markov chain) and finally to compute the Markov transition field from the transition matrix.

So a key step is to split the y axis of the time series in bins. N_bins is a hyper parameter you need to specify. Some restrictions to the number of bins you can use: greater than 2 and less or equal to the number of timestamps. You can experiment with it. Something I’ve used in the past is timesteps//2, timesteps//4, etc. As a result, you will see that the resulting image has more or less granularity.

2 Likes

Currently, I am using a subset of one of the public datasets. Later on we want to apply it to our own dataset. There are a lot of public EEG datasets available. At my first trials the accuracy was 60ish percent and tried a lot of ideas (some have worked many have not) and now in my 88th version of my notebook I am getting 87.5%. My target is beyond 90%. We will write a paper and once it is published, will be happy to share more about my methods and the paper… But basically pre-processing and domain specific knowledge was important to get beyond 60ish percent… This is a phd research and took a lot of work to get into this acc level…
For time series approach you mean 1d-conv DL models? That one has been attempted before in the literature and we are getting better with our approach…

Hi everyone,

I’ve been following fast.ai for a while now and been trying to go through the courses, a bit on and off due to lack of time, but now I decided to start from scratch and do the Intro to ML course first.

Due to my work I’m also highly interested in time series (sensor data) and have been doing some work with Facebook’s Prophet with some ok results. Right now I’m interesting in trying to build a DL model, with the Rossmann approach and embeddings as a basis. So atm I’m trying to extract and engineer additional features (as my original data just includes time stamps and a measurement).

However, my biggest concern is how I would generate a forecast with predictions for future dates, say the next 30 days, after the model has been trained and evaluated on a test set? I.e how would I use it in production? Perhaps this has already been addressed in some specific lesson? If so I would be super grateful if someone could point me in the right direction.

I have found a pretty relevant thread on this: Predicting on a single row with Rossmann Data, but it doesn’t seem like they’ve found a solution yet. I also looked into some tutorials on machinelearningmastery.com and the approach he uses is to preprocess the time series, splitting the data into input and output vectors. So the length of the output vector defines the number of time steps to be predicted by the model. However, not sure if this is the right approach with the fast.ai library.

I hope my thoughts make sense:)

I had to think about this and I guess this is incomplete as there can be nonlinear relationships too and the standard (linear) correlation coefficient will not be able to detect that. I guess, if the data would have only linear relationships we would be able to capture it with a linear model and would not need a NN which is capable of representing highly nonlinear data. (I guess, this is also why NN are so powerful.)

See this nice (but very mathematical) comparison of the (linear) correlation coefficient and Mutual Information and a nice visualization of this concept. (If this sparked you interest in Mutual Information & Co. I can highly recommend this blog post about information theory.)

Thank you! I will try that out. Do you or anyone know some good parameter values to use for MTF, GAF, or Recurrenceplots (for classification or regression) that worked for them at least? (e.g. GAF image size, recurrence plot dimension ,time delay, threshold, MTF image size, n_bins, etc…?) I ran it with the default values for GAF (summation) and the results are seemingly worse for time series forecasting. However, I am not sure if I am using it correctly (I am using Tensorflow for CNN using core API and I have [batch_size, sequence length, channels] for my tensors and am not sure if I am supposed to use the image transformations along batch size and sequence length or sequence length and channels).

@MicPie,

thank you for sharing your thoughts and all the insightful links. Meanwhile, I came to realize that all the correlation tests are actually pretty meaningless in practice. In my last experiment, I simply used Bayesian optimization and it just worked out of the box and delivered results far superior to anything I have done myself.

In a nutshell, building any deep learning model consists of three optimization problems:

  1. Find best features
  2. Find best model
  3. Find best model hyperparameter.

For (1), you can use either try & error, leverage domain knowledge or simply use genetic algorithms. The later deliver the same result as brute force search but at about 10X faster speed.

For (2), you can use any existing model, if good enough, build your own, or use deep neuronal evolution to find your best model. The latter is computational expensive.

For (3), your lucky, because that’s the easiest part because there are plenty of tools at your disposal. For starters, use known best practices as fast.ai is doing it all the time. Then, there is bayesian optimization, which is arguably a bit shaky when used standalone. Some folks question whether it is any better than open search, and indeed, the evidence seems inconclusive. However, when combined with evolutionary search strategies, it delivers superb results although in a non-deterministic way. In practice, I got the optimal result within the three runs or so, that’s actually a non-issue.

Also, there are model-agnostic tools to tune hyper parameter, although I have not explored them yet.

I think Jeremy recently made a point about not teaching Reinforcement Learning because it is in fact no better than any good search algorithm. A valid point he made, and I discovered recently that any crappy model optimized with a genetic algorithm easily outperforms the most sophisticated RL system by a wide margin. Conversely, those RL agents that actually do well in practice usually leverage a lot of optimization, either by using plain brute-force search or a genetic algorithm.

More recently, the decades-old genetic algorithm make a strong comeback, but now labeled as “Deep Neuro Evolution” to auto-optimize RL/Agents and Deep Nets with millions of parameters. Uber heavily invests in that field because of the simple reality that any auto-optimizer is doing better than any human whenever your model becomes complex. And there is no shortage of complex models out there, but certainly a shortage of highly optimized ones. It is very telling that Google, Uber, and OpenAi moving all beyond RL and towards Deep Neuro Evolution since all three have the problem of optimizing large and complex models.

https://eng.uber.com/deep-neuroevolution/

Reinforcement Learning may or may not survive the decade, but Deep Neuro Evolution is meant to stay simply because it is going to solve a ton of really hard optimization problems within a reasonable time and with reasonable resources. By reasonable, I mean 48 Cores instead of the hundreds of GPU’s/TPU’s Google loves to use in its experiments. When you can auto-optimize a common architecture and hyperparameter within an hour or less, I take it any day.

2 Likes

@MichaelO

Use probabilistic programming to tackle the 30 days forecast problem. However, you have to spend some time on feature engineering to make the DL working well first before leveraging probabilistic programming.

2 Likes

I was wondering if anybody has any idea regarding how to pass stacked images as input in FastAI? Also, not exactly sure if I can use a pretrained model such as resnet on this since its not been trained on 6 channel input. I have encoded my time series as recurrence plots – but I want to pass 2 recurrence plots at a time (each recurrence plot is generated from a different time series but they are related) for a single label.

Has anybody tried this before? Please share any ideas/things you’ve tried before. Thanks a lot!

I think it’s important to clarify something. When you apply an image transformation (like Recurre Plot, or GAF, MTF, etc) to a univariate time series you get a 2d squared array (just one channel). If you apply a color map (like viridis) using matplotlib to that array, then you’ll get a 3d array with 3 channels. But you don’t necessarily need to do that.
So if you want to apply 2 recurrence plots to 2 time series (of the same length), you can just create them and then add a third channel that may be all 0s. And you would get an image with 3 channels.
If you truly want to have a pretrained model that takes more than 3channels, you would then need to modify your nn (you could copy the pretrained weights and have as many channels as needed).