Energy industry experts + deep learning wizards + idea incubator = ???
This thread was posted after I wanted to connect with more people in the energy industry (where I work) to discuss how deep learning may pave the way for solutions to problems specific to energy. I know there are more people out there who are well-versed in problems specific to their domain (like me), but may be at the beginning of their fast.ai journey. I believe this is exactly what Jeremy is after with fast.ai – diversifying the AI workforce.
Most of us in the energy industry come from a world where the concept of open source and ‘sharing’ really isn’t a thing. The more proprietary data and knowledge you own, the better positioned you are to profit. It’s a status quo that is severely outdated! Let’s try and break some of those barriers down.
So, if you work in Energy Industry in one or more of the following disciplines – you’re in good hands.
Solar
Wind
Oil
Gas (+ Biogas)
Nuclear
Hydro
Coal
I encourage you to share / discuss / debate / collaborate on any neat stuff being done with deep learning in energy, even if it’s just an idea you have - or even if it’s something you saw or tried that didn’t work! I’m hoping we can focus on real-world problems and leave the research-y stuff on the sidelines (not that it’s not great as well).
I will do my best to keep a running list of the things that people have posted.
For those who are new to the energy industry, welcome to our world. Listed below are a few resources that keep me up to speed on what’s unfolding in the industry. This is the backbone to powering your (and Amazon’s) expensive, high-end GPUs! That’s right, it takes energy in the form of electricity to separate cats from dogs.
BP Statistical Review of World Energy (Full Report)
This report tells you how much energy the world consumes each year. Last year, world energy consumption increased by 2.9%. That beats global population growth of 1.1%, which means most of us are using a little bit more energy year over year.
IEA World Energy Outlook (Exec Summary)
This report tells you our best guess at how much energy the world will use in the future, and where it will come from. My biggest takeaway is that while renewables grow substantially on a percentage basis, oil-gas-coal will remain a huge piece of the energy mix.
IPCC – Global warming of 1.5°C (Exec Summary / Full Report)
This mega-report (616 pages!) from the Intergovernmental Panel on Climate Change goes into detail on how the world’s energy consumption habits are negatively affecting the planet.
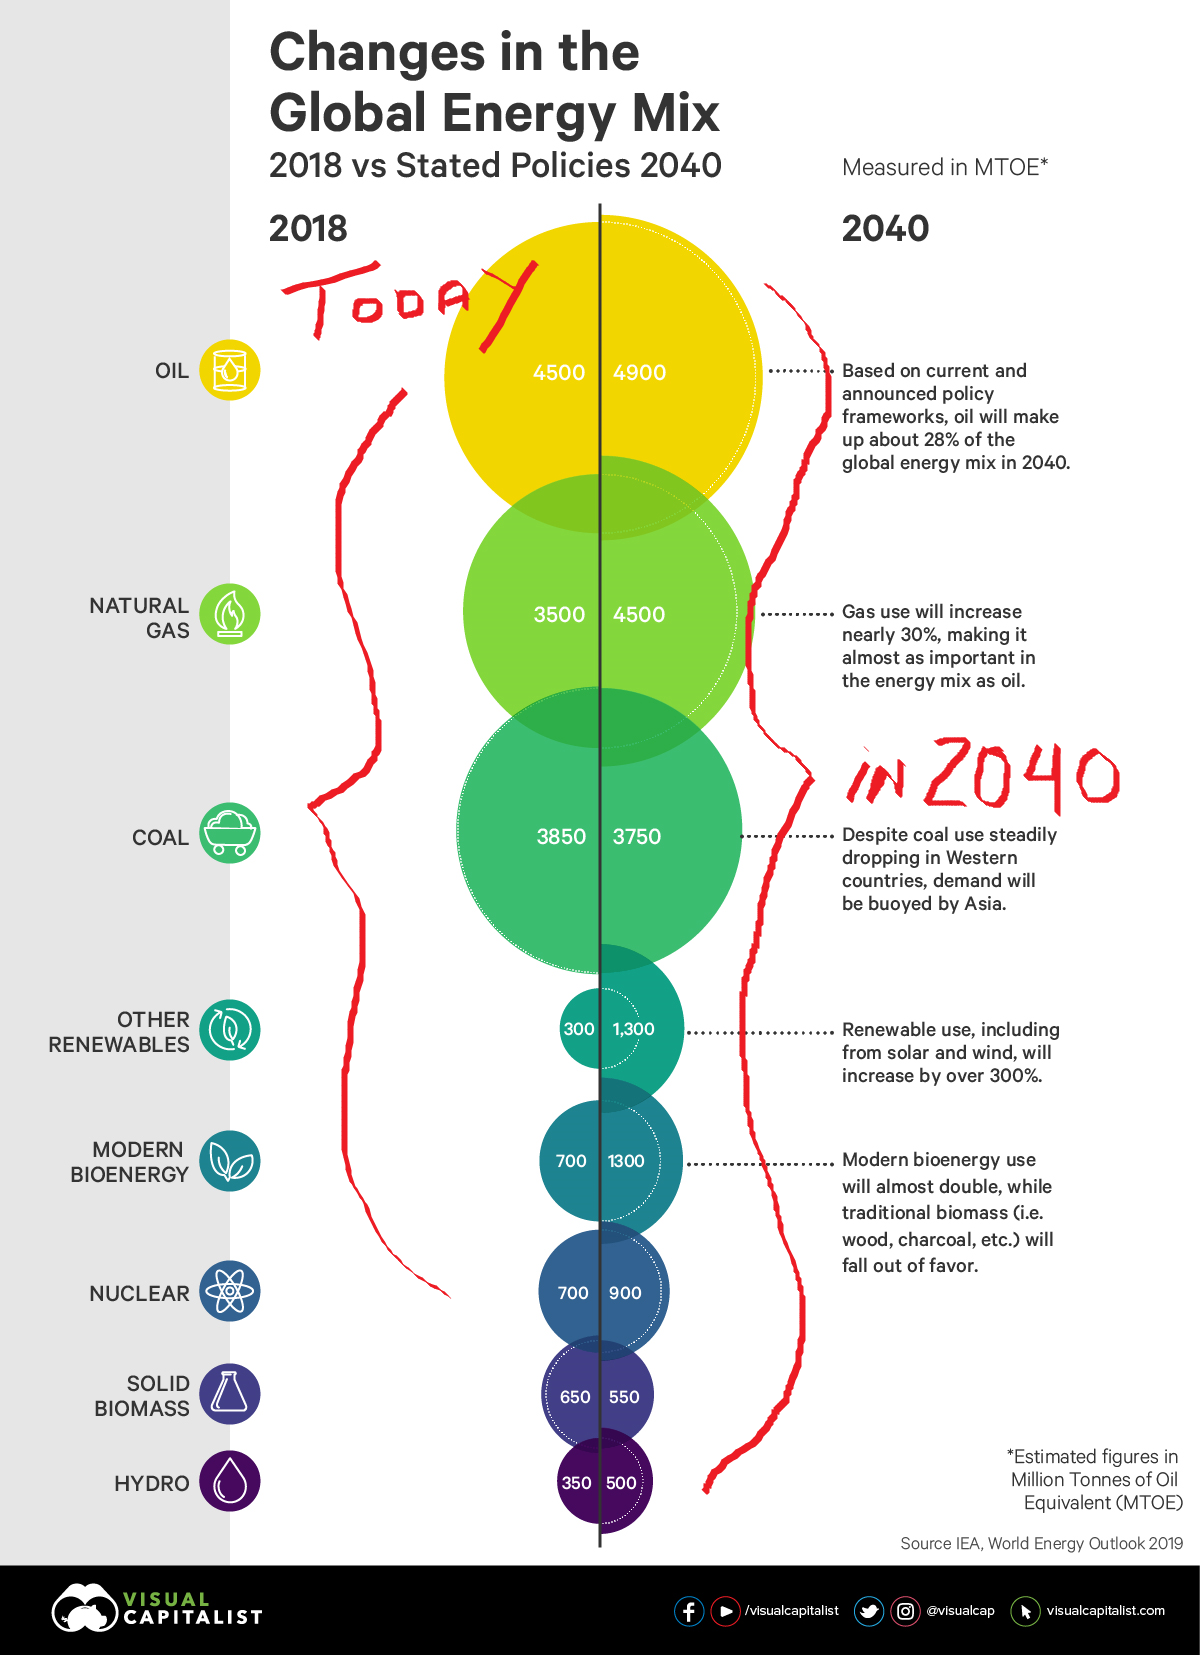
For those who like pictures, here is a nice visual created by Jeff Desjardins showcasing the IEA’s assessment of where our energy consumption is headed for 2040. My biggest takeaway is that while renewables grow substantially on a percentage basis – we will continue to rely heavily on oil, gas, and coal to feed our appetite for energy.
Since I started this thing, I guess that means I should go first.
Here is a project I began during fast.ai Part 1 as my ‘personal project’. I’m still actively working on it!
Project
Finding Light Oil Production Sites in Saskatchewan, Canada using Satellite Imagery
Goal
Methane emissions reduction from light oil production in Canada. Eventually, real-time emissions detection using additional satellite data.
One-sentence summary
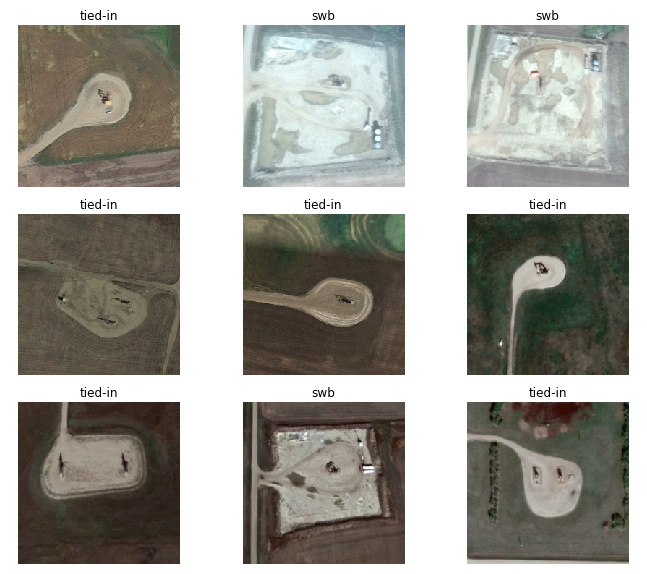
Train a model to identify oil production sites using Google Earth imagery, then classify each wellsite based on the probability that its venting methane into the atmosphere.
Tell me more
Based on infrastructure seen in satellite imagery at each wellsite, we can make an educated guess on whether or not the wellsite is venting methane from its tanks (which has a global warming potential of 20x that of CO2). The ability to quickly find well sites that are venting methane is step 1. From there, step 2 would be to pair this data alongside methane concentration readings from the Sentinel 5P satellite. The ultimate end-goal here would be the ability to link a site flagged by the deep learning model to an increase in methane concentration seen by the Sentinel 5P satellite.
Results
Currently able to differentiate between three different types of infrastructure with an accuracy of 74%. Humble beginnings. My dataset was built by hand using screenshots from Google Earth, therefore is limited in size. My next step is to figure out how to automate this process. Chemical engineer by day, struggling coder by night
I attended a meetup last year (or maybe the year before) where someone from one of the major energy companies in my country explained how they’re using ML on the raw energy usage data in their households to figure out what sort of devices are being run at what time of day.
Basically their smart thermostat (I think it was) keeps track of power demand throughout the day, but this is a very noisy signal (it just measures the load on the house’s electricity network). However, each type of electrical device has its own kind of signature (a washing machine is different from a fridge, etc) and with the ML they can filter out when what device is being used and how much power these draw (without having to attach a separate kWh meter to each device).
Neat idea, but as this involves many households, their servers were quite busy crunching all this data, so they were thinking of doing the actual ML inside the smart thermostat.
That’s quite clever. It sounds to me like it could eventually reach the point where you could turn on any appliance in your house and see the energy it consumes in real-time. The real kicker for me is that you wouldn’t need to know any technical specs or consumption ratings of the appliance itself. Thanks for sharing!
Here is another great use case of deep learning in the Energy space that I came across this weekend. I think it’s worth sharing because it has running room for real-world application. A team at Duke University did some great work (kudos!) in advancing energy infrastructure mapping using deep learning. Their best model results came from the RetinaNet architecture.
Project
Mapping Electricity Infrastructure with Deep Learning
Goal
Fill the information gap in the electricity access space in developing countries. The aim was to create reliable electricity infrastructure mapping that could be put in the hands of policymakers to help them get power to those who are (still) in the dark. They state that 14% of the world population still lacks access to electricity.
One-sentence summary
Ability to map electricity infrastructure from electricity generation (start) to consumption point (end).
Results
The team was successful in building a model using RetinaNet to map five key components of infrastructure in the electricity grid. They also evaluated the generalizability of the model across geographical regions (deset, suburban, plains, and forest). Unsurprisingly, the model worked best when it was trained using all geographical regions. The last item they evaluated was the minimum resolution needed to resolve infrastructure in imagery. They found that higher resolution (< 0.30m) produces better results, anything larger than a 0.5m resolution yields a significant decrease in performance.
Credit
Project team at Duke University is Lin Zuo, Varun Nair, Atsushi Hu, Wendell Cathcart, Ben Alexander - with support from their faculty advisors Kyle Bradbury and Leslie Collins.