Here is the github link with complete implementation. I followed exact same steps as mentioned in paper. But still, the results are not that great yet. I am going to be experiment more on the same, in order to ahieve top leadership score.
I would love to get any suggestions/ comments for further improvement, if anyone gets time to go through it.
However, we found that it was difficult to train such a simple model because it does not take into account any prior information on the distribution of the data. To tackle this issue, we integrate prior knowledge of the destinations directly in the architecture of our model
Such a nice little way to look at things to add to one’s mental arsenal for tackling problems
If I understand it correctly, for validation set the last year was chopped off completely and they used data up to the previous year only? Then they used same periods as in test set but minus 1 year?
I found the below paragraph confusing:
On these 3422 output from hidden, we take weighted avg which will just be sum of multiplied probability into cluster center (i.e. sum of 3422 elements). It includes no traning, just using previous probabilities, multiplying by fixed crntroid coordinated and calculating weighted avg.
This is just as softmax, right? We are basically trying to predict the probability of a centroid with a given id?
Wait a second
Pass input data to a dense layer which has 500 outputs and those 500 to relu.
Pass coming data to a linear layer which has 3422 outputs
These 3422 outputs passed to a softmax (which will give p)
These 3422 p’s will go to linear layer which does not update weights. just multiply p and c .
So learning stops after softmax but for output we muliply coords of each cluster by probability and sum them up? This is so neat
These two articles (one and two) helped me understand what the haversine vs equirectangular distances were. Quite interesting that the simpler one gave better results!
Thank you very much for sharing this Prince This has been a tremendous learning resource and gives a nice feel for the architectures people are using to solve various problems.
Then they used same periods as in test set but minus 1 year? – YES. This made validation set to have almost as many rows as the the test set and I guess to incorporate seasonality.
But they did not only completely chop off data upto last year. We do have 2014 data in training set also.
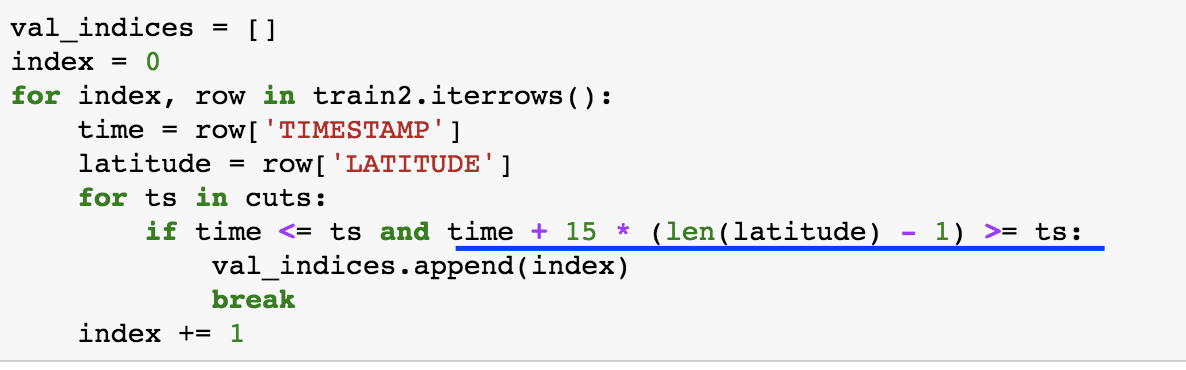
To be honest, I did not completely get the logic behind highlighted part of the below image. Just took this part of their code for validation split. Let me know if you understand the intuition for the highlighted part.
Exactly. Softmax layer has 3422 outputs which are considered as probability of being in each cluster. Then final location is calculated in the last layer which has fixed weights and weights are centroid locations of 3422 clusters. Basically, the final layer gives a weighted average of each cluster centroid.
Thanks :). Although for now I use only MSE as loss function. My next experiment is to try changing it to equirectangular distance and see how it improved the score.
It has been learning resource for me too. Even after knowing the exact solution to the problem, making this ipython nb involved a lot of experiments and I understood a lot about PyTorch nn implementation and how to scrap fast.ai functions. As you can see, I did not use any fast.ai wrapper. But I had to dig deep into fast.ai wrappers and understand the implementation to customize for my problem.
I can share a list of basic challenges faced when we write nn from scratch using PyTorch and how to tackle those.
Thanks for sharing! How far away from their performance are you? What are your guesses as to where you’re different?
How about setting up an environment where you install the same versions of the same software as them and run their code directly, so then you could debug each intermediate step and/or the per epoch results by comparing to them?
Right now, the score is bad. Mean Haversine Distance of 7 as compared to 2. Here are my guesses about what can improve the scores:
Using equirectangular distance is loss metric. Right now I used MSE for simplicity
Use of learning rate finder and cyclic learning rate. Right now I just used 1e-3
Maybe more epochs will help in overfitting. I used 3 epochs for now. Or actually I can try to train model with smaller lr for a much longer time. like 10-15 epochs? That might help, I guess.
What do you think could be the cause of bad score?
They worked on Theano. I think running their scripts would be easy as they have given steps to do that. Yeah, actually comparing per epoch score difference might help in pointing to some specific direction. Will check that out.
Difference between 7 and 2 is not likely to be due to any of the things you mentioned - unless your LR is totally wrong and it’s just not training much at all. So yeah try the LR finder next. If that suggests your LR is OK, then my guess is that you’ve got a bug in your pre-processing. A score of 7 is nearly last on the leaderboard - so you should start with a much simpler model that gets in the top 50%, then work up from there.