Hi,
I’m very new to using FastAi for tabular data.
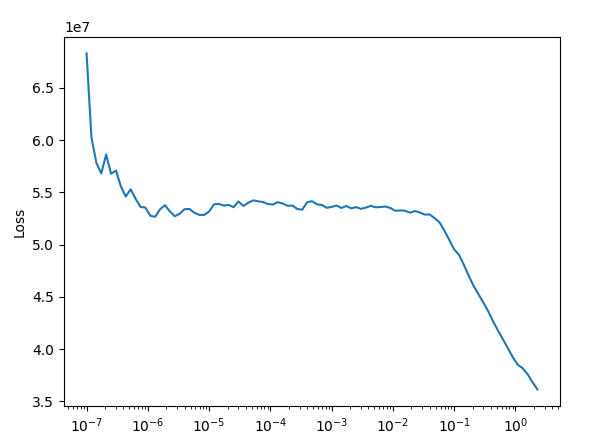
I’m trying to get a baseline before doing any feature engineering and I’m getting very strange curves when I call lr_find.
With no preprocessing, I’m getting this curve:
Also, when I train for a few epochs, the train and validation losses are very, very high and the exp_rsmpe metric is displayed as ‘nan’:
epoch train_loss valid_loss _exp_rmspe time
0 10518176.000000 10338683.000000 nan 00:09
1 10055361.000000 9702557.000000 nan 00:09
2 9326493.000000 9653540.000000 nan 00:09
3 9790043.000000 9585298.000000 nan 00:09
Could someone point me in the right direction?
I’m wondering if these kinds of results indicate anything in particular. Are there any rules of thumb for analyzing and correcting whatever it is I’m doing wrong?
Thanks for the response.
I was mostly wondering if what I am seeing is symptomatic of something obvious. There’s a lot of feature engineering going on in the fastai examples with the Rossmann dataset, so I’m trying to figure out what kind of problem with the data could cause these results.
Here’s the code:
    dep_var = 'Sales'
    procs = [Categorify, FillMissing, Normalize]
    df = pd.read_csv(r'/home/tim/.kaggle/rossmann/train.csv', index_col='Store')
    conts_raw =  ['Customers']
    cats_raw =  ['DayOfWeek', 'Open', 'Promo', 'StateHoliday', 'SchoolHoliday']
    # PyTorch doesn't like y to be int RuntimeError: exp_vml_cpu not implemented for 'Int'
    # without this dls.train.y is integers``
    if df[dep_var].dtype == int:
        df[dep_var] = df[dep_var].apply(lambda x: float(x))

    dls = TabularDataLoaders.from_df(df, cat_names=cats_raw, cont_names=conts_raw, y_names='Sales', procs=procs)


    metrics = exp_rmspe
    layers = [1000, 500]
    learn = tabular_learner(dls, layers=layers, y_range=(0, 32547), metrics=metrics)
    learn.fit_one_cycle(4, 1e-4)
you can toy around with the batch size. Example.
Looks like in the original example the dep_var is converted to logarithmic scale. You may wanna try doing that!
Also I feel number of hidden layer activations (layers) you chose are a bit high and the learning rate a bit low.
Thanks.
I’ll look at that example.
I noticed that TabularPandas is converting the continuous variables to integers.
I’m going to create a new topic for that. I suspect that is what’s causing the training weirdness.