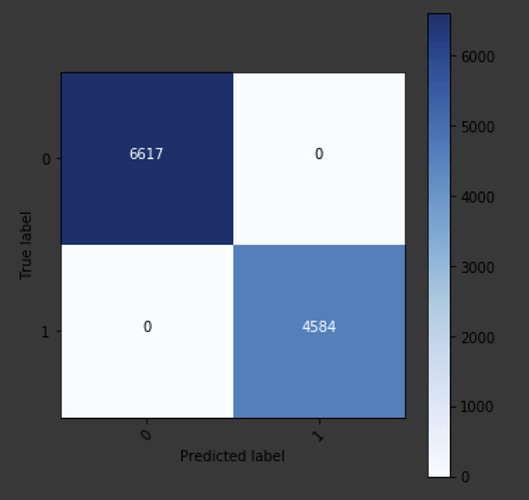
When training a tabular model I get approximately 59% accuracy, however when I plot the predictions in a confusion matrix I basically get 100% accuracy, so I was wondering if anybody could assist me in understanding where I might have gone wrong.
This is a binary classification issue with quite an unbalanced data where 66k == 0, and 9k == 1. Because of this, I have made efforts in trying to get the validation set to be ~50/50 and putting the rest in the training (no test set for now, because of the project’s nature).
This effort consists of defining a new dataframe consisting of all rows where target == 1, splitting it in 2:
df_churn_train and df_churn_test.
df_churn = df_copy_classification[df_copy_classification[‘SOURCE’] == 1]
num_churns = len(df_churn)
num_churns_train_test_distribution = round(num_churns/2)
df_churn_train = df_churn.iloc[num_churns_train_test_distribution:]
df_churn_test = df_churn.iloc[:num_churns_train_test_distribution]
assert num_churns == (df_churn_train.shape[0] + df_churn_test.shape[0])
Then define a new dataframe consisting of all rows where target == 0, splitting it in 2:
df_not_churn_train, df_not_churn_test, with a 90/10 split.
df_not_churn = df_copy_classification[df_copy_classification[‘SOURCE’] == 0]
num_not_churn = len(df_not_churn)
num_not_churns_train_test_distribution = round(num_not_churn/10)
df_not_churn_train = df_not_churn.iloc[num_not_churns_train_test_distribution:]
df_not_churn_test = df_not_churn.iloc[:num_not_churns_train_test_distribution]
assert num_not_churn == (df_not_churn_train.shape[0] + df_not_churn_test.shape[0])
Furthermore, I concatenate all of these such that the validation data is in the last part of the dataframe, with the motivation of knowing their indices.
df_train = pd.concat([df_not_churn_train, df_churn_train], ignore_index=True)
df_test = pd.concat([df_not_churn_test, df_churn_test], ignore_index=True)
df_combined = pd.concat([df_train, df_test], ignore_index=True)
Then I get the indices of the validation set (please ignore me calling it “test” in the code)
val_range_min = (max(list(df_train.index.values)) + 1) # end of the training set
val_range_max = val_range_min + max(list(df_test.index.values)) + 1 # From end of training set to end of test set
Then define and train a model as seen in the Rossmann notebook
procs = [FillMissing, Categorify, Normalize]
data = (TabularList.from_df(df_combined, cat_names=cat_vars, cont_names=cont_vars, procs=procs).split_by_idx(list(range(val_range_min, val_range_max))).label_from_df(cols = dep_var, label_cls = FloatList).databunch())
learn = tabular_learner(data, layers = [512, 256], ps = [0.6, 0.5], emb_drop = 0.5, metrics = accuracy)
learn.fit(1, 1e-5)
As mentioned this gives me approximately 59%, and further training only results in overfitting and no increase in accuracy.
However, when I try plotting the confusion matrix
preds = learn.get_preds(DatasetType.Valid)
y_val = df_combined[‘SOURCE’][val_range_min:val_range_max]
conf_mat = confusion_matrix(y_val, preds[1])
plot.plot_confusion_matrix(conf_matrix=conf_mat, classes = [0, 1])
I get 100% accuracy (if I am not reading this matrix wrong)
Note: the “confusion_matrix(y_val, preds[1])” is sklearn’s confusion matrix, which I input into plot.plot_confusion_matrix() - this is fastai’s confusion matrix with a few modifications.
