I am getting this error while using log_loss function from sklearn with one level. I looked it up and saw that there was a known bug on sklearn using for one label but it was supposed to be fixed in later release. I upgraded sklearn using
conda update sk-learn but it didn’t resolve.
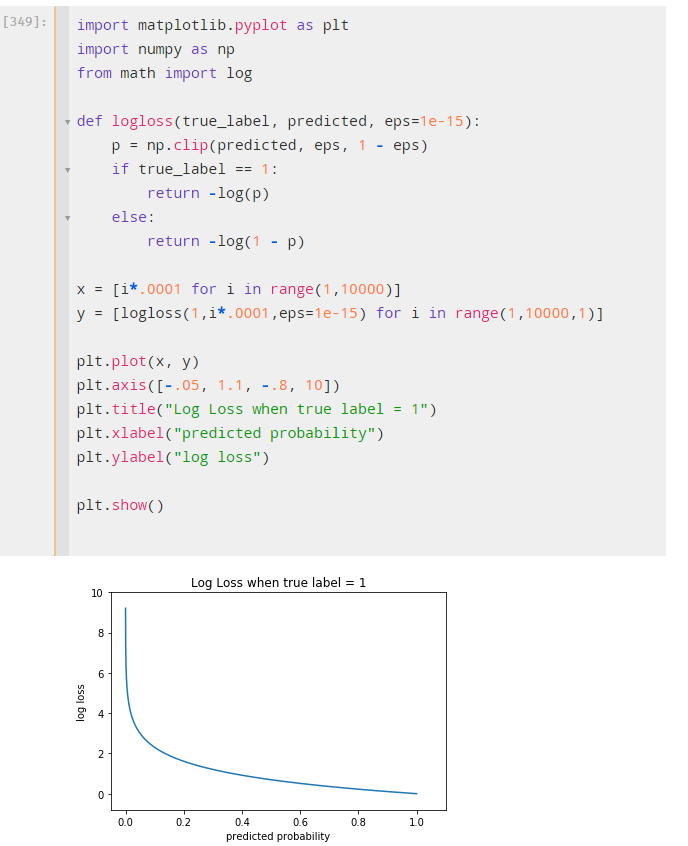
The code:
import matplotlib.pyplot as plt
import numpy as np
from sklearn.metrics import log_loss
x = [i*.0001 for i in range(1,10000)]
y = [log_loss([1],[[i*.0001,1-(i*.0001)]],eps=1e-15) for i in range(1,10000,1)]
plt.plot(x, y)
plt.axis([-.05, 1.1, -.8, 10])
plt.title(“Log Loss when true label = 1”)
plt.xlabel(“predicted probability”)
plt.ylabel(“log loss”)
plt.show()
Error:
ValueError: y_true contains only one label (1). Please provide the true labels explicitly through the labels argument.
I am getting the same error. I found some git issue where it says its class imbalance problem between truth and prediction. Our truth is set to 1 while our predictions have a range.
# Visualize log loss for a large number
from sklearn.metrics import log_loss
x = [i * 0.0001 for i in range(1,10000)]
#y = [log_loss([1],[[i*.0001, 1-(i*.0001)]],eps=1e-15) for i in range(1,10000,1)]
y = [log_loss([0],[[i*.0001,1-(i*.0001)]],eps=1e-15, labels=[1,0]) for i in range(1,10000,1)]

plt.plot(x,y)
plt.axis([-0.05,1.1, -.8, 10])
plt.title("Log loss when true label = 1")
plt.xlabel("Predicted probability")
plt.ylabel("log loss")

plt.show()
Did have the same problem.
In my case shuffling the rows in the dataframe worked just fine. (Data was in order so the first 100 rows or so had the same value)
Use:
dataframe.sample(frac = 1)
frac = 1 will resort all rearrange all rows