I work on time series data for system and business monitoring. The most common way to work with time series data is directly on the time series data points and use things like moving averages, regression, and neural networks.
I have always wondered how well it would work to simply convert the time series data to images and use convolutional neural networks for image classification. The intuition is that “we know an anomaly when we see one” - so why not just do that?
TL;DR is that using fast.ai on time series images I generated, I have been able to consistently get to around 96-97% accuracy on this task.
This is kind of amazing because the time series data I trained on are from different time series domains (like service API latency versus purchase volumes) and generally the thought has been that we need to fine tune for each domain.
Here are some examples.
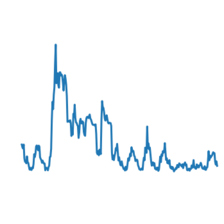
Anomaly: this time series has a spike toward the vewry end. I generated the images with some buffer at the right. I may experiment with making this lag window narrower in the future.
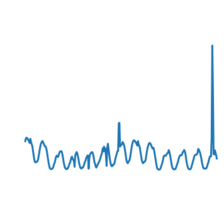
Normal Time Series: This example is normal at the right edge, which is where we want to detect anomalies. The spike toward the left might have been an anomaly at that point in time, but we are not interested in that now.
I have roughly 100 anomaly images and 400 normal images.
Notebook is shared here.
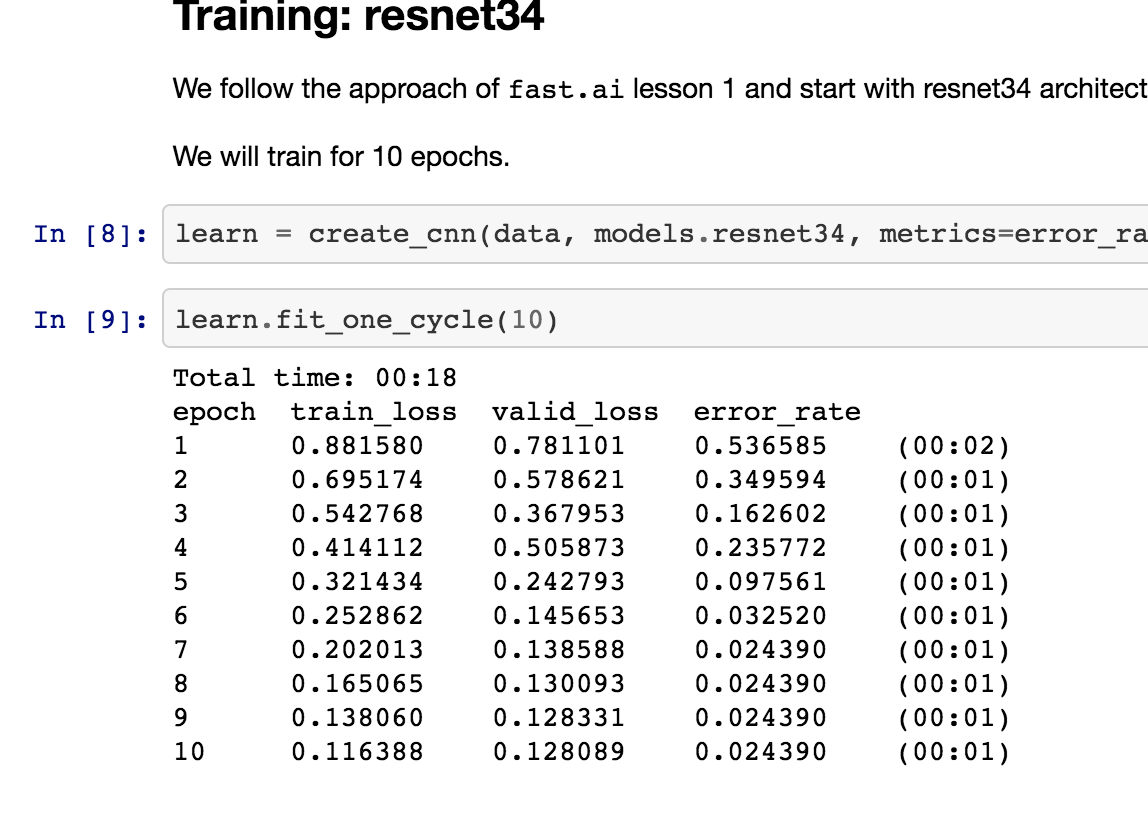
Training results: