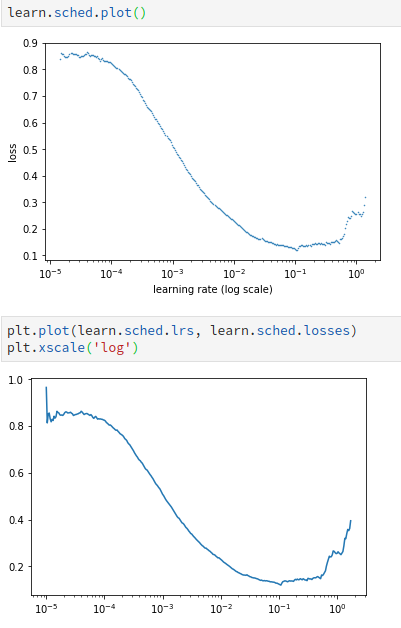
Newbie here. Started a few days ago. Trying out v3 today. My lines of code yesterday no longer work. learn.sched seems to have reincarnated as learn.recorder? learn.recorder.lrs does look like what learn.sched.lrs used to be, but learn.recorder.losses doesn’t seem to be what learn.sched.losses used to be?
If you look closely, your first two plots aren’t exactly the same. There is a little more points at the beginning and at the end.
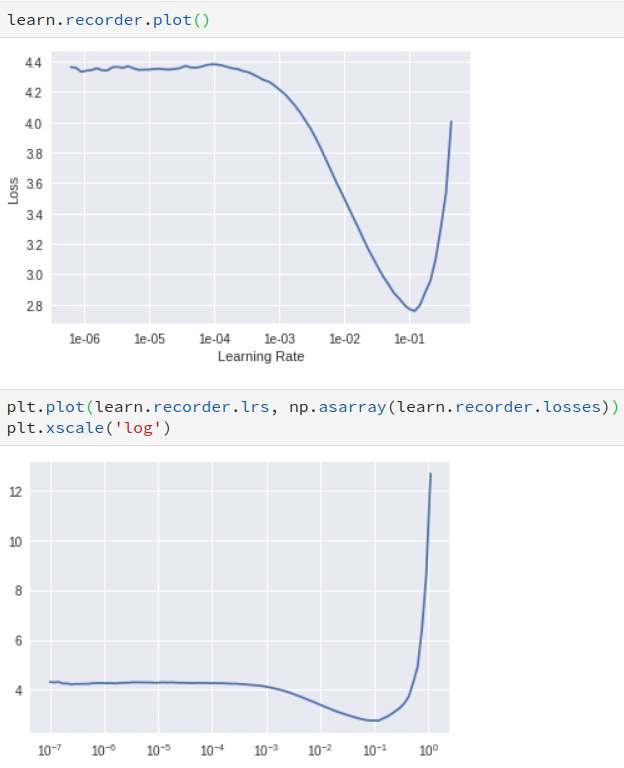
That’s because the plot()function doesn’t plot the very first nor the very last values of the loss. This was done to avoid what you have in your 4th graph, a squeezed plot due to very high values at the end.
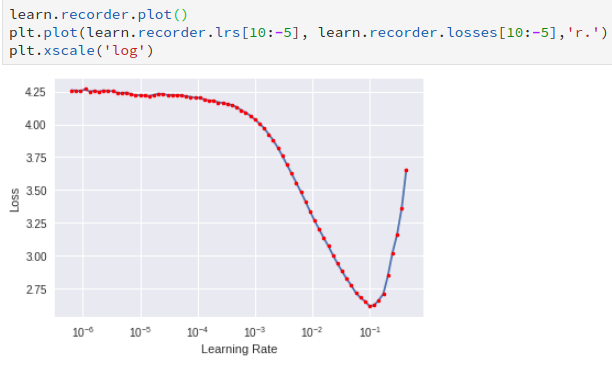
When writing your learn.recorder.plot, just hit Shift + Tab to see the arguments you can pass to this function. You will see skip_start and skip_end, those values are the number of loss values that you won’t plot using this function. So I would say that your 3d and 4th graph are still the same, but because you have very high values at the end (that you don’t skip because you use the full array of values), it looks very different. Just look at the value where it starts (around 4) and the value of the minima (around 3) are still the same.