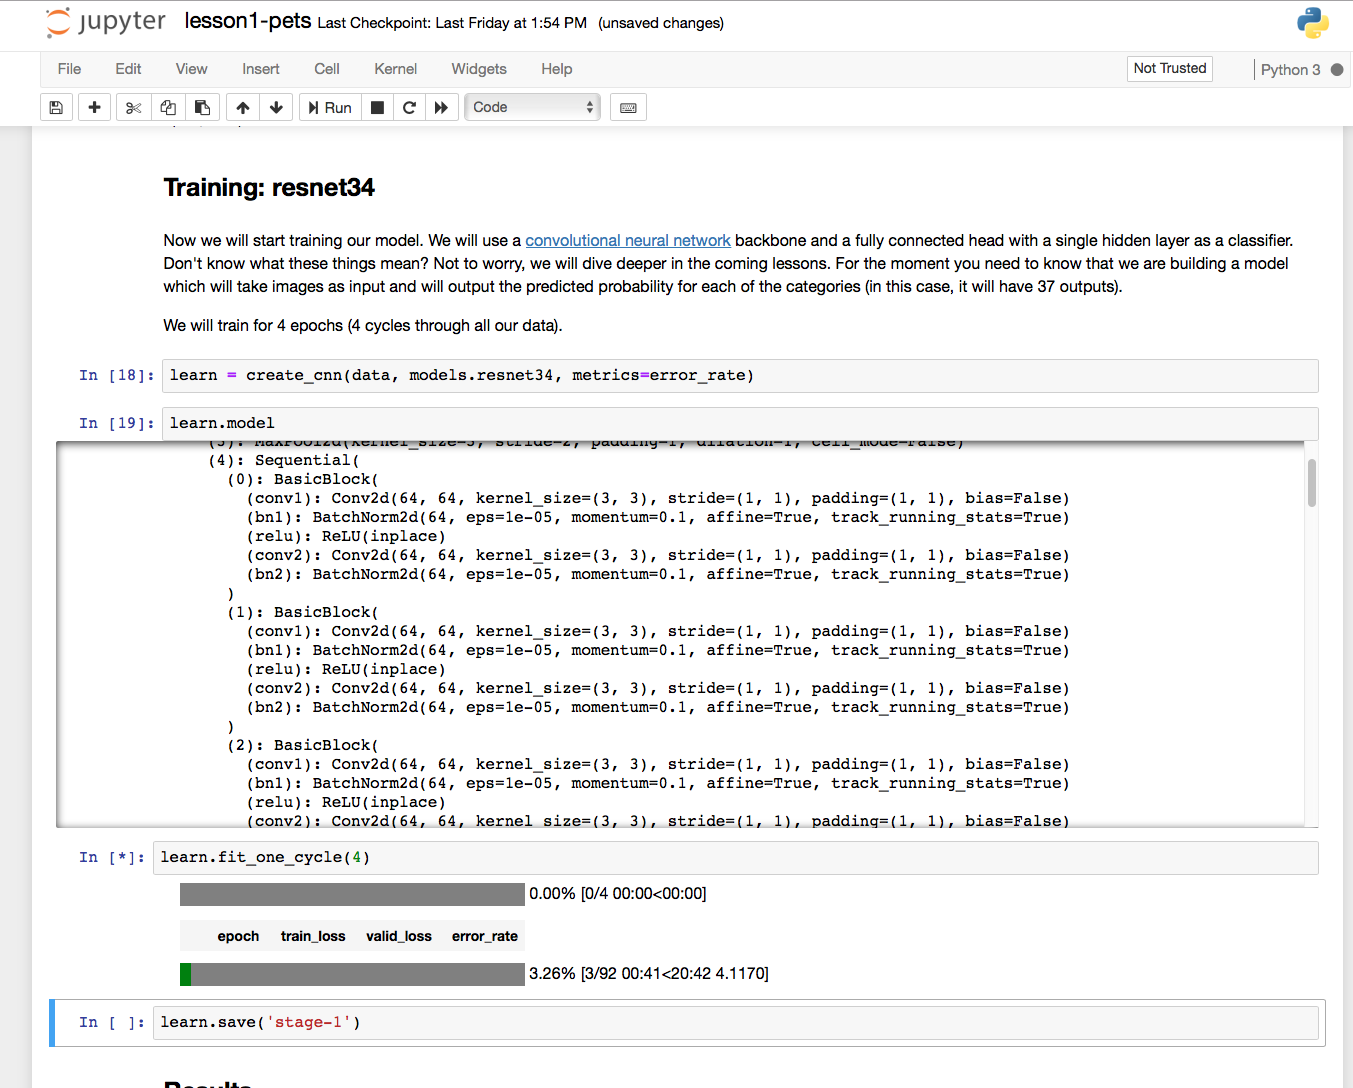
I followed the instructions from https://course.fast.ai/start_sagemaker.html and have my ml.p2.xlarge-backed notebook up and running in AWS. The issue I am finding is that it takes approximately 20 minutes for each cycle (learn.fit_one_cycle(4)) to complete in lesson 1, whereas I believe it should complete in a handful of seconds for each cycles since it is only doing fine-tuning (see screenshot below).
Why is it taking so long? Could it be running on the CPU instead of the GPU? If so, how would I find out that that is the case?
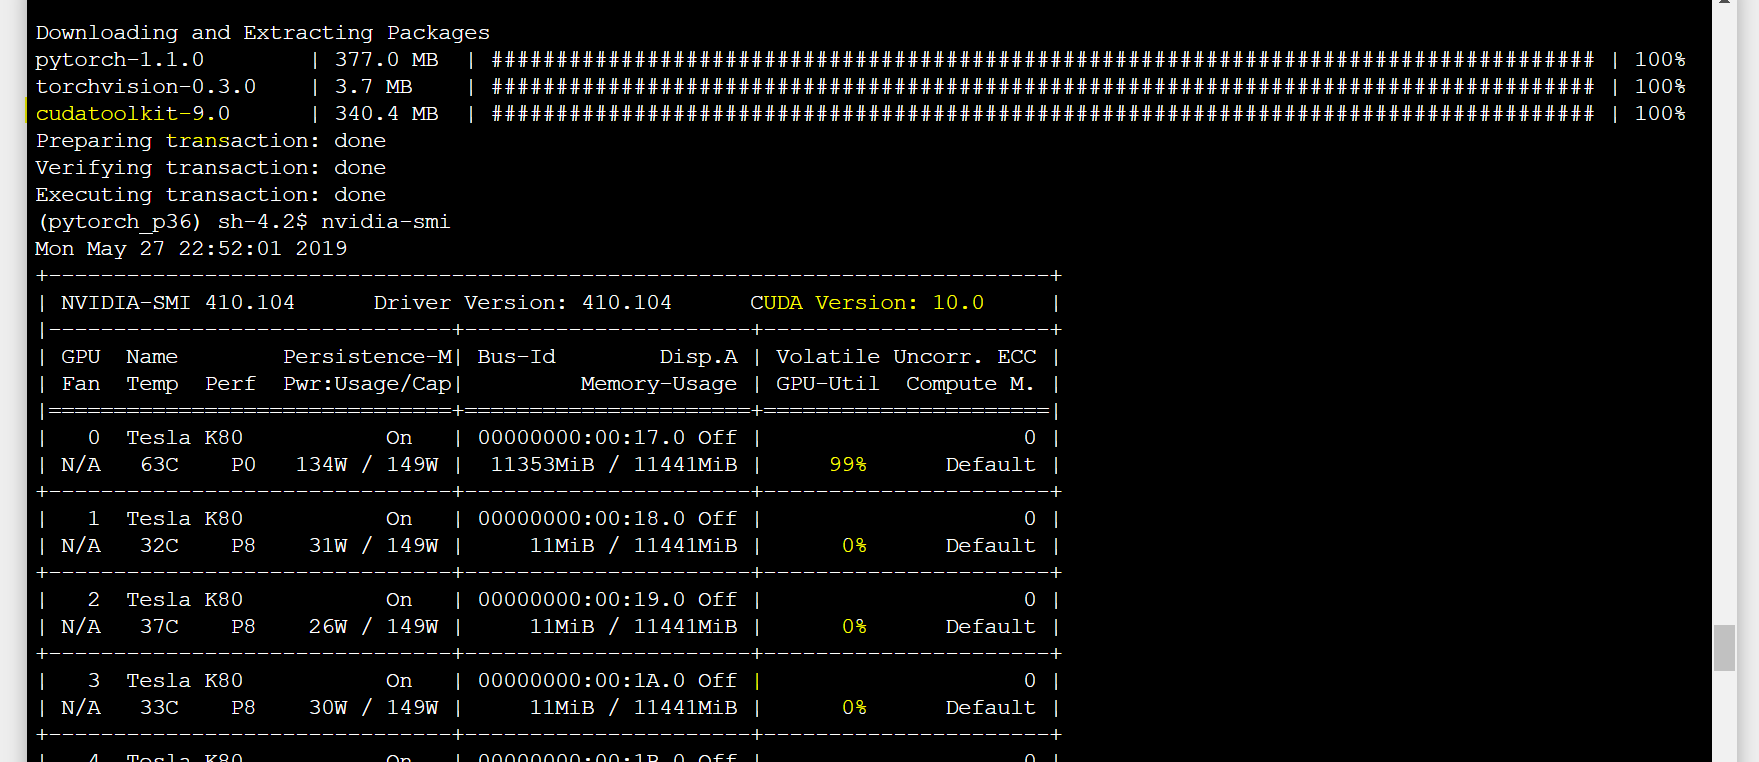
If you want to see if it’s using the GPU, you can go to the Jupyter notebook homepage. In the upper right, there should be a dropdown where you can select a Terminal. The terminal will open up in a new tab and from there you can treat it like any other terminal.
In your case, when the model is training, go over to the terminal tab and run an nvidia-smi command - see this fastai thread for a few different options if you haven’t used it before
I had the same problem with my Sagemaker notebook instance.
I verified that CUDA was not running by adding a code block to my Notebook and trying:
import torch
torch.cuda.is_available()
For me, the result was False - which says pytorch is not using the GPU. It took 40 minutes to run the fit call learn.fit_one_cycle(4).
Turns out the version of pytorch that gets installed when fastai gets set up on the machine - expects Cuda 10.0. But Sagemaker has 9.0 installed and active by default.
You can solve this by installing pytorch with the 9.0 version cudatoolkit. I made the changes for the “sagemaker-create” script and submitted a pull request to the fastai course-v3 repository: https://github.com/fastai/course-v3/pull/211
If you already have a Sagemaker notebook instance running, and you would like to fix it so that Cuda/GPU is working:
From Jupyter, click the “New” button in the upper-right and select “Terminal”
This should give you a summary of changes it will make. Just type y and press enter to accept the changes. For me, these were the important changes that it made:
The following packages will be UPDATED:
    pytorch:     1.0.1-py3.7_cuda10.0.130_cudnn7.4.2_2 pytorch --> 1.0.1-py3.7_cuda9.0.176_cudnn7.4.2_2 pytorch

The following packages will be DOWNGRADED:
    cudatoolkit: 10.0.130-0                                    --> 9.0-h13b8566_0
After this completes, make sure you shut down and restart any notebooks that are running from the fastai lessons. (You can find these in the “Running” tab.) Or if you have them open in a browser tab, you can reload the kernel by pressing the zero-key two times: 0, 0.
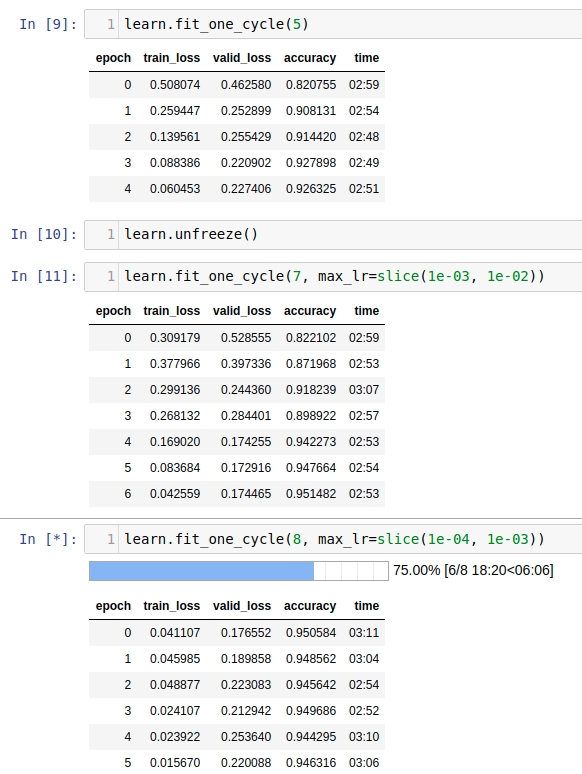
After I did this, I could run the fit command learn.fit_one_cycle(4) in 1m50s on my Sagemaker notebook instance.
I downgraded cuda in the Conda environment as suggested. torch.cuda.is_available() returns True instead of False and the training time is down where it belongs for GPU standards (4 minutes to run learn.fit_one_cycle(4))
I’ll point this our and +1 the relative PR.
Other than that, I now owe a beer to @stevenlybeck whenever he is in town. Thank you all for the pointers!
What about the case of wanting to run on multiple GPUs?
ml.p2.xlarge (1 Tesla K80) was not enough for me so I decided to run on ml.p2.8xlarge which has 8 Tesla K80. I was feeling there was no improvement so I checked the nvidia system management interface (nvidia-smi) and realized only 1 was actually being used during fit.one_cycle. I am sure it must be one line of code… Does somebody know how to fix it?
Hi,
I am facing the same issue when training on Sagemaker.
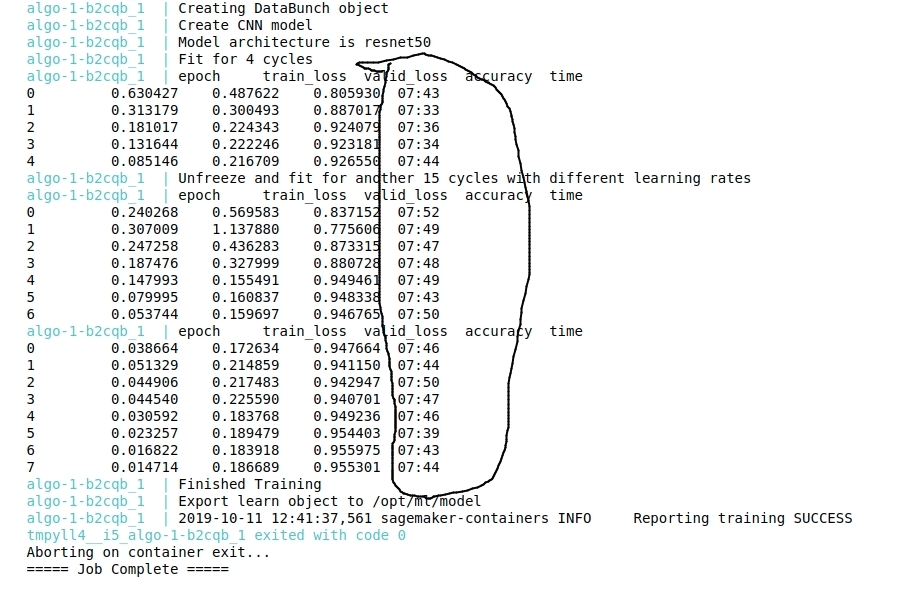
I created Sagemaker resources using CloudFormation as mentioned in this blog and followed the tutorials -
Here is the screenshot of training time on sagemaker - Training machine - ml.p2.xlarge
I am facing quite a similar issue as well. I ran my code in SageMaker earlier, and it ran fine. But, for the last 1-2 days, it is taking a lot of time to run my code for the first time. When I run it for the second time, it runs faster (I guess it’s storing previous info in a cache). I really don’t know what the issue is. Whatever be the code (be it data preprocessing by reading large amount of data from the files, be it the model execution, the time consumption is excessive. It takes 3 hours for just 1 epoch to train while it took just 4 minutes earlier. Did anyone identify the solution?