Update: I’ve cross-posted the question on devs section as well. Probably it is worth to merge these threads together for the sake of clarity to carry on the discussion in a single place.
This question was raised several times on PyTorch and fastai forums/issue trackers but I would like to clarify, is it possible to safely use num_workers > 0 in data loaders? Is it possible to use all available CPUs or better use less than available?
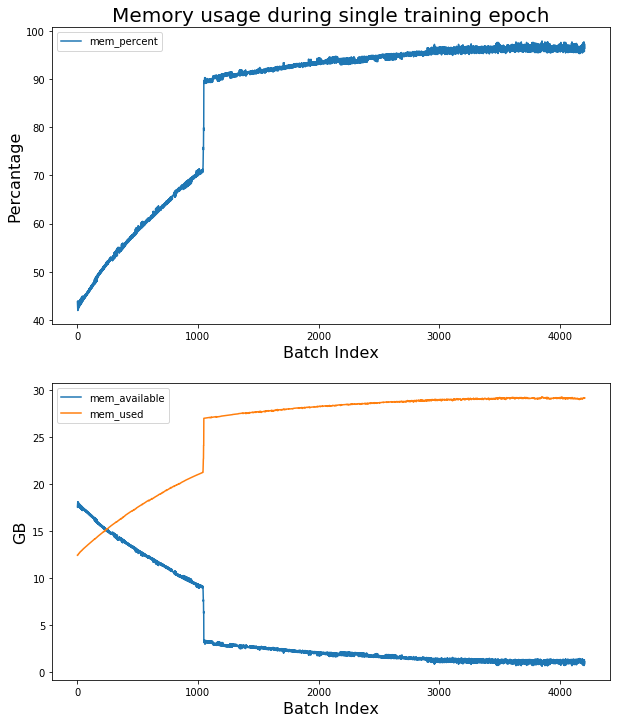
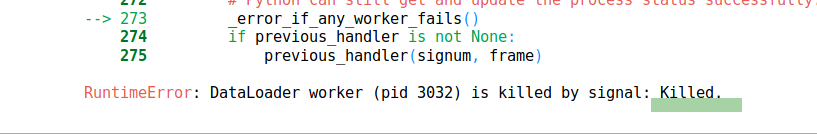
The reason I am asking is that during a couple of weeks I am struggling with the error from the title of this post. Every once in a while, the training process is killed due to lack of RAM. I was tracking the amount of memory used while running the training process via free -mh, and it shows a slow decreasing of the amount of available memory during a single training epoch. I guess something goes wrong because it shouldn’t increase indefinitely, right? Sounds like a memory leak, from my point of view. Or am I doing something wrong?
Here is a Gist I am using:
It seems that the PyTorch community claims that the problem is in custom datasets. The fastai forum seems to say the opposite And, the general advice is to use num_workers=0.
Also, I’ve seen an advice about increasing the amount of swap space. However, I am not sure if it can help as soon as all my 32GB of RAM are getting occupied during a single epoch, and I guess adding more space can’t really help.
Probably I just don’t understand something. Could you please let me know if someone else has a similar issue? Do I just need to use a single core?
If somebody would like to know more or try to help with the issue, I am ready to provide information about my setup, hardware, gather memory usage log, etc.
I have it continuously, and it hinders my workflow quite a lot. I don’t think memory is an issue: I get that error even on a DGX station which has 256gb of RAM. The notebook throws the signal error way before RAM gets fully occupied.
Setting num_workers=0 in the dataloader addresses the problem, but slows down things substantially.
Yes, exactly! It is a real trouble for a few weeks already. It just swallows all the memory I have. Yeah, agree, if something fails on DGX then probably it is not due to hardware issues =)
I guess that I haven’t seen it previously because the datasets shown in the lectures are not that big. And most of the popular datasets are quite small as well. So the memory leak is not revealed probably.
And, you’re right, single-threaded execution really slows down the execution. Especially, if you have a few dozens of cores.
Yes, sure! I’ve started thinking that I am just doing something completely wrong if nobody else has this problem, and PyTorch forums keep silence as well
I work with very large datasets (indeed, my boss lets me use the dgx), and I get that error continuously. It seems that pytorch dataloader is not capable of working with real-world datasets AND multiprocessing. Going from 40 threads to 1 thread on the dgx, the difference in speed is immense. I really hope they could address that problem quickly, but judging from what I read on the forum, they haven’t any clue yet.
I think the vast majority of people just works with small datasets: in the end, they allow you to learn without spending too much time in processing the data and training the net on them.
Right, I am doing the same and mostly work on smaller datasets that fit into memory even if the leak exists. The problem was revealed only when I’ve done with experimenting and decided to train the model using more data to see how it will affect the accuracy.
Ok, I’ve tried to create a simple notebook for tests, to reproduce the leakage. There is a script also in this repo but it is not synchronized with the notebook yet.
Of course, any other experiments are highly appreciated to help to track down the issue.
Yeah, that’s a real trouble. I see a serious drop in performance even on my machine when switching to single-threaded execution. If this problem really comes from PyTorch’s DataLoader implementation, can’t figure out how it wasn’t spotted earlier? Don’t want to switch back to Tensorflow
Hm, that’s interesting, I don’t have memory errors with smaller datasets. Could you please tell me, what dataset you use? The problem is that the kernel kills my training script when I run it on huge amounts of data, i.e., a lot of training batches.
Ilia, which platform are you using? It seems that I have the exact same error on Paperspace P5000 with 32GB CPU, and there is no such problem on GCP (exact same configuration as @hwasiti mentioned). However, I have some other issues with GCP – it works extremely slow on big datasets. htop shows that though I explicitly mention num_workers=8, there is only one process running.
Thank you for your feedback! Yeah, that sounds interesting. So it seems that the GCP doesn’t use 8 workers as you ask, right? Probably that’s the reason why there is no error on that platform. Because everything works fine (though tremendously slow) with num_workers=0.
I am using a dedicated desktop with the following configuration:
However, I believe that I’ll see the same problem on other machines as well. I have also tried V100 on Salamander but somehow it was slower than my local machine so I’ve stopped training and didn’t have a chance to check if the problem exists here as well.
I am going to write a custom training loop to see if the problem exists when using plain PyTorch.
But, googling this I quickly found that there are potentially many different things going on, and the second, highlighted part of the error is very critical. So could everyone here check that we actually have the same error, otherwise we might be researching different things. Possible endings of the error message after the colon:
Killed
Terminated
Bus Error
Illegal Instruction
All of these may stem from different problems.
@devforfu, Thank you for the helpful callbacks, I will try to use that now for further investigation.
By the way I am having the problem on the same huge dataset you are using in your first snippet above…
Ubuntu 18.04, only 16GB RAM.
@marcmuc Not a problem at all, thank you for your response! It is really important to gather as much information as we can. At least, it is a good thing that we can reproduce the same error using the same dataset but on different machines.
In my case, I for sure can say that I had two of them (using almost identical training code):
Killed
Bus Error
I am not sure if I’ve ever seen Terminated, and as I can recall, I’ve never had Illegal Instruction.
Do you think that all these errors categories represent something different? Could it be the same reason but failed in different stages? Like, we have a memory leakage in some specific place of the code but as soon as these kinds of problems are highly non-deterministic (taking into account multithreading and amount of available memory on different machines), we’re getting different “flavors” of the basically same exception?
I mean, in one case, the OS just kills the process in advance when sees lack of memory, in another case the process tries to allocate already occupied memory as soon as there is no free space, and is therefore killed, etc.
However, you’re definitely right, and it is a good idea to carefully record every case.
I ran your notebook without modifications. It used the oxford pet dataset.
If you want me to check it on any other dataset, please make changes on your notebook, and I will run it and report you back.
Do you mean the GCP instance is running slow for tasks involving I/O to the drive?
Usually the preprocessing and 1st training epoch needs the drive. 2nd epoch and further will use the cache of the OS and drive will be idle.
What I discovered is that the GCP drive is very slow. That’s because GCP is dedicating a limited speed for the drive depending on the the size of the hdd. 100 GB SSD will give only 50MB/s write or read. Once you increase the size in the edit of the drive you use in the VM instance specs the drive speed increase (500GB SSD → 250 MB/s). But once you increase the size you will not be able to decrease its size. The price of 100GB SSD is $17/month which is not cheap.
Yes, you’re right, with Pets dataset everything is fine. The main idea of that notebook is to provide some basic playground to test the model’s training code on various datasets and with various training parameters. (However, even in case of that dataset, I guess we see a small increase in consumed memory during single epoch).
Originally, I’ve encountered the problem when worked on Quick Draw Doodle dataset. The dataset requires some preprocessing before training and takes about 7GB of memory in CSV format, so I didn’t include it. The plot you see at the top of this post is generated during training on that dataset.
I guess the problem is revealed when one tries to train the model on large datasets that don’t fit into RAM require > 10-15K iterations per epoch.