So, I don’t know if the forum is the best way to go for this, but for the class notes of rf_interpretation from partial dependence on, I am completely lost.
Does anyone have annotated notes or general ideas on what is going on in each section (partial dependence, tree interpreter, extrapolation)? Mainly I do not know whats being interpreted or concluded from the given tables and graphs…
Maybe start by watching the video of that section, and try to slowly step through lining up what I said in the lesson with what you see in the notebook.
Then, if there’s a specific point where you’re unclear on something, let us know in as much detail as you can what your understanding is as to what’s happening there, and what is unclear.
(For someone to try to summarize every section of the notebook is a big ask - it would be amazing if someone does it, but in the meantime we may need to tackle things one piece at a time ).
Okay so I’ve gone back and looked over Tree Interpretation and Extrapolation. I guess I really want to work on getting the general concept behind why or when we do these things.
For tree interpretation:
Is the purpose to be able to explain where a particular prediction comes from? Or is it giving us more than that?
I still cant answer how it works. How is the contribution calculated? Per row? Per tree?
Extrapolation:
My understanding is that we want to avoid using time variables as predictors if we can use something else that is stronger in order to make a model that generalizes better. Is this correct?
When should this be something we consider doing?
Is extrapolation only relevant for datasets where time plays a big component or are there other situations where this could be useful?
Sorry for the overload of questions. I’d be happy to split them up if thats easier.
My understanding of tree interpretation is:
It allows you to look inside your rf model to know how much each feature is contributing towards the prediction for it to be different from the bias(initial mean). i.e. it adds explanatory power to a particular prediction. Here is a set of examples that calculates contribution for single row as well as two datasets using tree interpreter.
Yes exactly! An example I mentioned in class was: what if your model was for insurance pricing, and a customer asked why their price was higher than they expected.
Everything with a random forest must be done per tree. And there’s only one row in our example. Have a look at these articles and see if they help:
Yes this is a subtle issue, but the problem is that a tree can only make predictions based on previous observations being “similar” to the row you wish to predict. I think we should discuss this more in class - I’ll do so on Tuesday.
I also have a similar question about the partial dependence section. It says in the notes that it is easier to do after one-hot encoding, but I am uncertain what the purpose of these plots and such are used for. In the case of Redundant Features we dropped Year Made, but in the Partial dependency section we just look to see how exactly the variables are related. Are we doing this specifically for Interpretation or is this used for creating better models as well?
Is the purpose of this to show us that there can be alot of hidden aspects within features and there are many ways to deal with them(ie. either drop or create a new column that includes two related features)??
The two things that you most need to know about a dataset are probably:
What drives the dependent variable (i.e. the thing you’re interested in - in this case, price)
How are those drivers related to the dependent variable (i.e. how would changes in those variables impact price).
For (1), we do feature importance. For (2) we do partial dependence. (2) is nearly entirely for interpretation, rather than improving predictive accuracy.
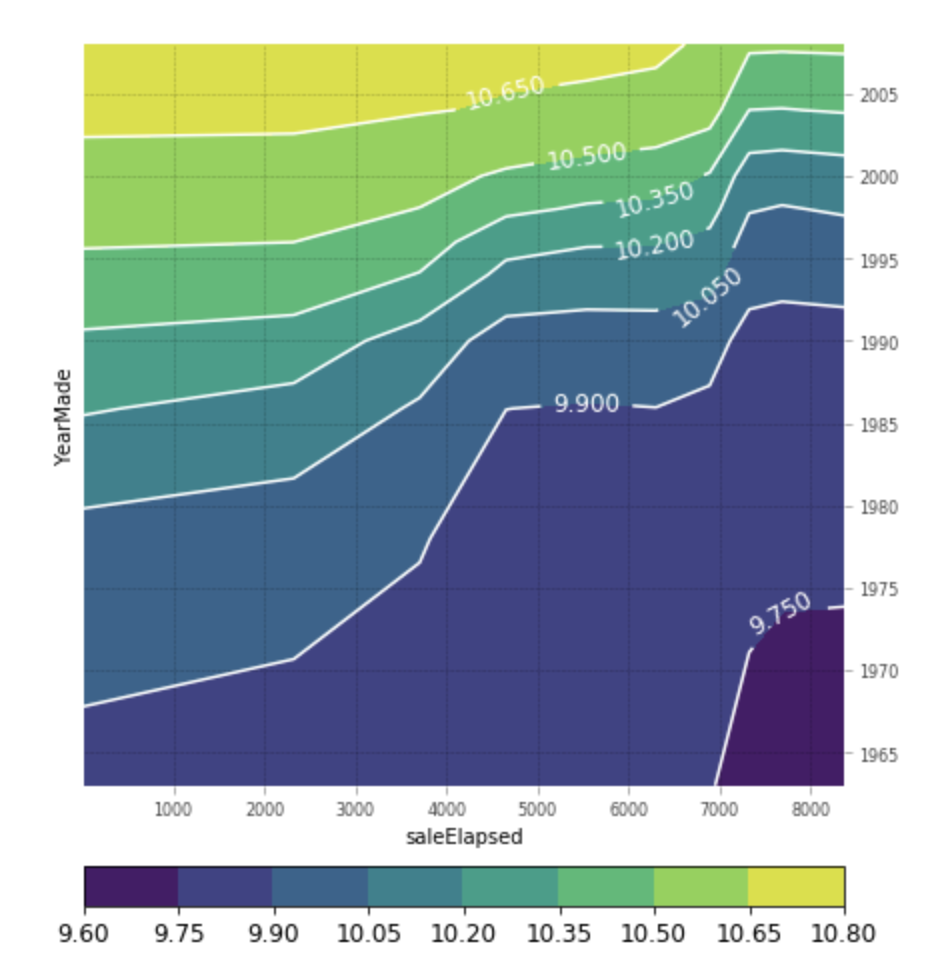
I have another question on the partial dependence interpretation. This plot is showing how much the prediction is affected by both YearMade and saleElapsed. Is this plot also used to explain the interaction between the two features? Is there a better interpretation of this plot? Thanks!
 ).
).