RetinaNet for Digit Detection?

Hello,

I recently tried to recognize digits from from power meter readings. For this task I used the RetinaNet from @Bronzi88’s great notebook.

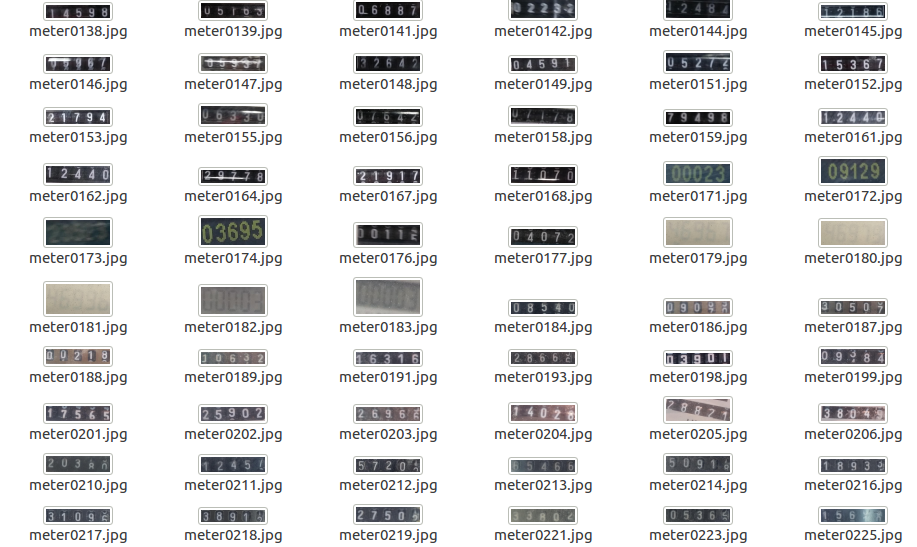
I got mediocre result, where seemingly more difficult digits are recognized and obvious ones not at all.
My question is, if RetinaNet is not the right approach to his problem?

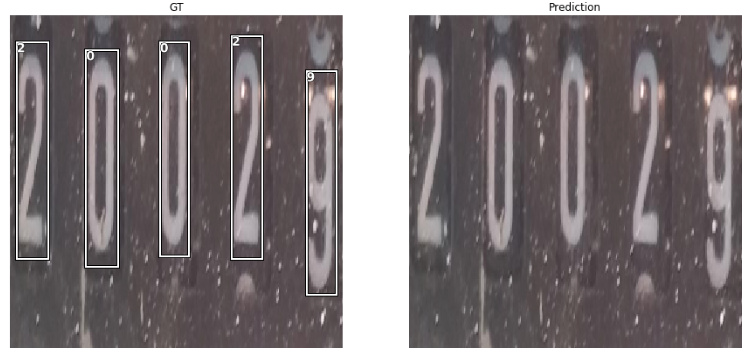
This is the loss after 300 epochs of training at 1e-4 learning rate, looks fairly ok to me.
image

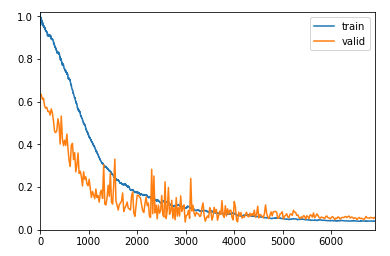
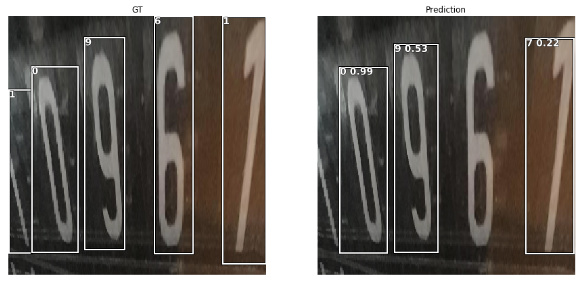
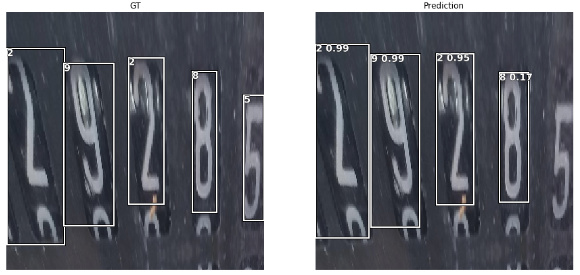
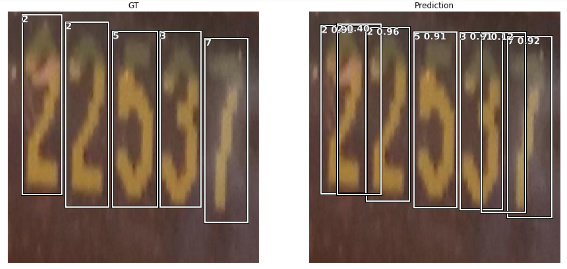
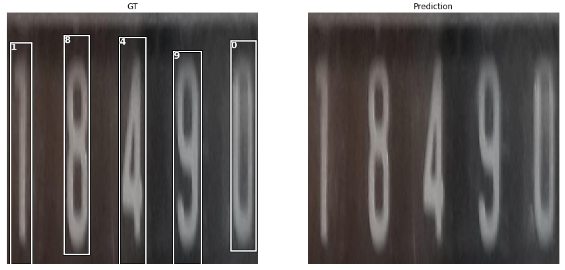
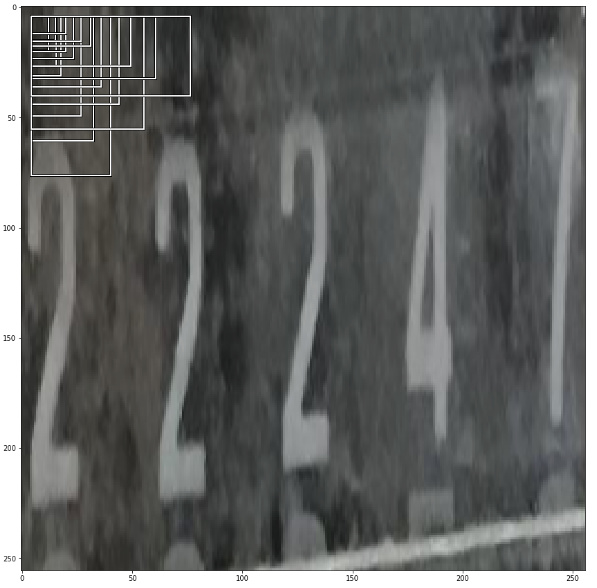
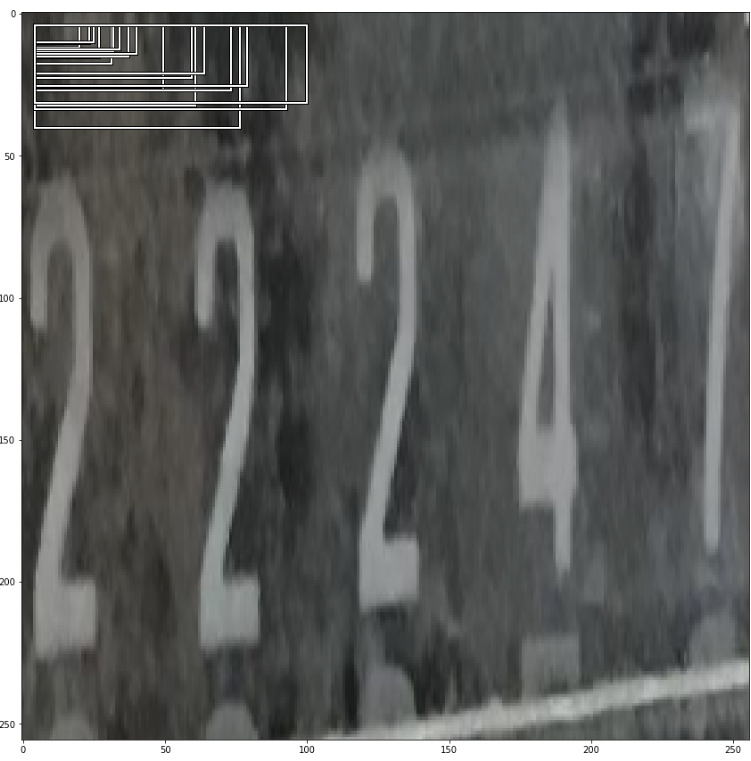
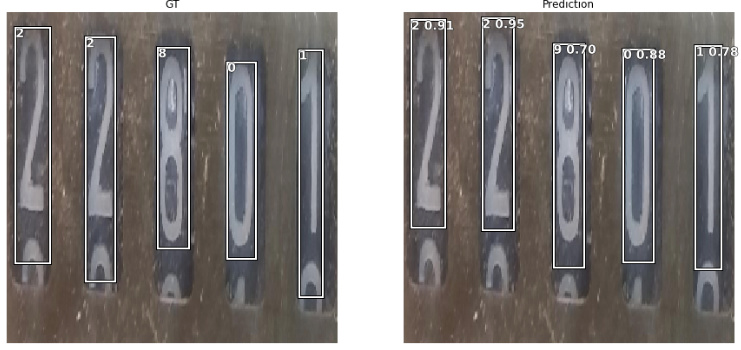
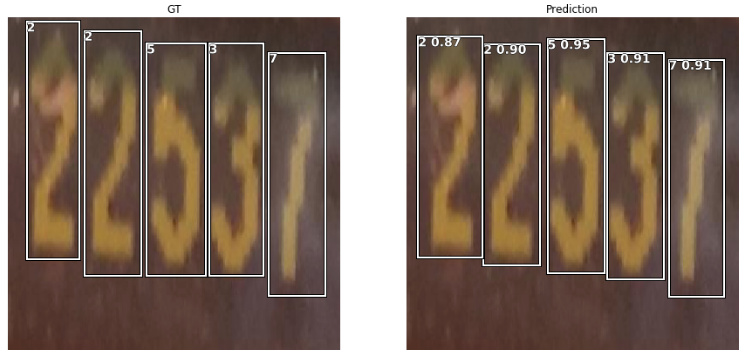
Here are some weird examples of detected and undetected digits.

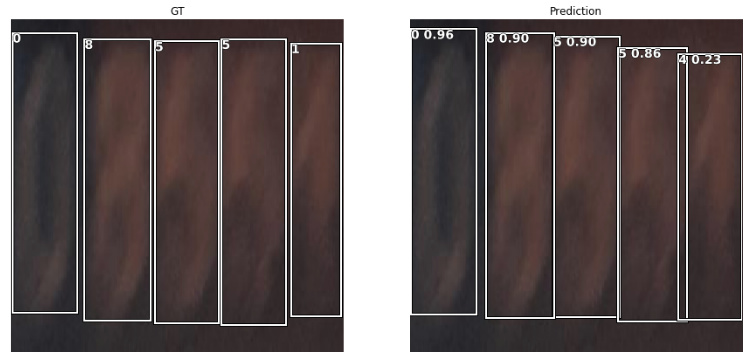
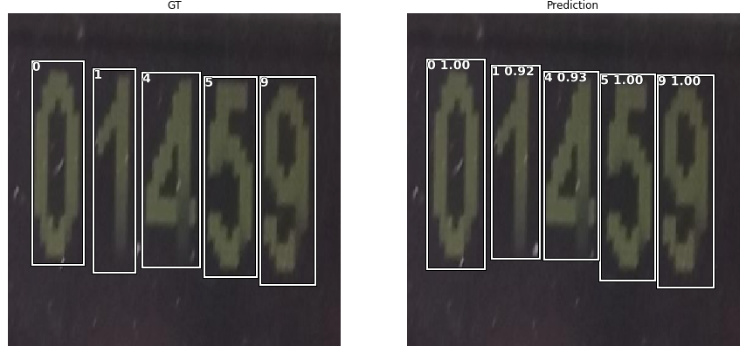
Very blurry digits are recognized with above 0.9 probability, whereas very clear digits as seen in the first example are not detected at all.

4 Likes

Hi (Moin),

that’s more than unexpected.
It train-val loss looks good and I’m surprised how good RetinaNet is with the middle picture in the middle.

One question: In the first picture is another type of power meter, do you have something like that in your train data? But actually, I can not explain it to myself even then.

With kind regards,
Christian

Thanks for the quick answer!
I was surprised as well with the detection of the picture in the second row. Even a human has a hard time recognizing those digits.

I do have lots of those types of power meters as seen in the first row in the training data. Below is a screenshot of some of the meters in the training data:

As you can see there are all kinds of meters, including the type of meter the model has serious problems with…

Hi (Moin),

that is more than strange.
There has to be some sort of pattern.

First: I would use the train images and let me show the predictions on them.
Second: If you reduce the detection threshold and increase the iou threshold are boxes shown?
Third: Are you using the PascalVOCMetric during training

voc = PascalVOCMetric(anchors, size, [i for i in data.train_ds.y.classes[1:]])

This is just a blind guess, something I would check first:
Did you have a look at your data augmentation? Are you sure that there are this sort of sharp inputs with strong contrasts are left after the data augmentation? Maybe trying to randomly sharpen the images or adding contrast as a data augmentation step might help to stabilize it for those cases, if it doesn’t exist already.

I think so too, there has to be some pattern, but I can’t figure it out.

First:
Here are some excerpts from predictions on the training data. Looks a lot better, however some images are still not recognized.
image
image
Second:
Reducing the detect_thresh to 0.1 and incresing the nms_thresh to 0.5 doesn’t really improve the detection. Some images now have too many bounding boxes like this:
image
Others are still completely unrecognized:
image
Third:
Yes! I am using exactly the specifications you wrote in your notebook.

Thanks for your suggestions!
I am pretty much using the standard get_transforms() fastai transformations, without flipping vertically or horizontally.
They seemed to provide a wide range of slight transformations that suits my usecase. I thought the train and valid/test datasets are similiar enough that I didn’t increase contrast.

What’s the intuition behind setting anchor sizes, ratios and scales?

I used the anchor sizes from the coco notebook. Are they too small/granular for the task at hand?

@faib here is a good medium article discussing the topic:

4 Likes

Thank you very much for pointing me to the article @muellerzr . I was able to debug my workflow and found the error which was causing the detection only of certain kinds of meter readings!

The issue that caused some sort of pattern to occur, was that I didn’t adjust the anchor boxes to fit my training set. I used standard anchor sizes for object detection in the coco dataset. The predefined anchor boxes were narrow enough to catch some of the meter readings with fonts that were had wider digits, however to catch all digits the anchor boxes had to be a lot more vertically stretched.
I changed the sizes from
anchors = create_anchors(sizes=[(32,32),(16,16),(8,8),(4,4)], ratios=[0.5, 1, 2], scales=[0.35, 0.5, 0.6, 1, 1.25, 1.6])
to
anchors = create_anchors(sizes=[(32,32),(16,16),(8,8),(4,4)], ratios=[2, 3, 3.5, 4, 4.5, 5, 5.5], scales=[0.35, 0.5, 0.6, 1, 1.25, 1.6])

There is a slight error in the otherwise amazing notebook from @Bronzi88 where the anchor boxes are plotted with the wrong rotation, plotting the chosen anchor boxes like below, which is why it took me a while to figure out my problem.

After figuring out this I was able to train the neural net a lot faster than before. There are still some classification errors but the object detection works like a charm.
Below is an excerpt of some predictions:


6 Likes

Hi ((Moin),

that looks like excpected :).
I will fix the bug after my vacation. Thanks for finding that bug.

With kind regards,
Christian

Hi @Bronzi88 and @faib,

Thanks for the very informative post and notebook files. I had a go at using the CocoTiny_Retina_Net notebook, and have a few questions about it. If you can give me some pointers about them, that would be much appreciated~!

Having used the following code to generate the anchors,

anchors = create_anchors(sizes=[(32,32),(16,16),(8,8),(4,4)], ratios=[0.5, 1, 2], scales=[0.35, 0.5, 0.6, 1, 1.25, 1.6])

it gave

len(anchors)
24480

But the next bit to visualise the boxes only referred to the first 18 boxes:

for i, bbox in enumerate(anchors[:18]):

and when creating the RetinaNet model, n_anchors was also set to 18. Why is that? Can a larger (or a different) number of n_anchors be used instead?

Also, the anchor box sizes were defined as sizes=[(32,32),(16,16),(8,8),(4,4)], and then consistently set when creating the RetinaNet model. I tried to add a further (64,64) to the sizes, but that does not seem to work. However, it seems to be ok to remove the smaller size (4,4) from the array though. I don’t really understand why that is the case?

Thank you very much for your help. And hope you are enjoying your vacation, @Bronzi88!

Yijin

1 Like

Hi @faib. I started working in a similar project to yours. I’m trying to detect all the digits that appears in a picture coming from google maps. Is it posible to get your notebook?, if it’s not possible, can you help me with a concrete learning path to achieve similar results. I have a good understanding of convolutional neural networks, how to build them and how to apply them, but I’m a kind of new in computer vision techniques like object detection. For example, how are you reading each digit in a single picture and telling to your network to predict only the digits enclosed into the boxes?. Are you creating binarized images of the content inside that boxes on the fly to feed your network?, because I was thinking in doing that but it sounds like a very inefficient approach to me. There are a plenty of information on the internet about computer vision and I’ll appreciate a lot if you can give some path to follow to save time.

Hi @edxz7,
just follow along with this notebook from @Bronzi88. It’s more or less exactly what I used and gives a clear walkthroug from reading in images to extracting and training bounding boxes.

1 Like

@edxz7 if you want to get a general understanding and quick overview of how object detection with bounding boxes works, check out week 3 of the 4th course of Andrew Ng’s deep learning specialization on coursera (or on youtube).
For a deeper understanding and implementation in pytorch/fastai check out the 2018 version of DL2 (“cutting edge deep learning for coders”) by Jeremy, especially week 1 (Lesson 8) and 2 (Lesson 9), which walk you through the entire implementation of a SSD / YOLOv3 style object detector from scratch (though they don’t use fastai v1).

2 Likes

Hey Fabian, thanks, I’m going to check that notebook with a lot of attention to learn from it.

@marcmuc thanks a lot for putting me on the right track, I started checking your suggested material and it’s exactly what I was looking for, something very concrete to start taking action. Now I can dive with more tools the notebook that Fabian suggested me in his last post. Thank you both guys.

1 Like

@faib
could you share your notebook?

@faib Great job, I have a question relate to your dataset.
I see that your image is in horizontal rectangular size, did you transform it into square size such as 256x256 or 512x512 before feeding to RetinaNet?

1 Like

I tried both stretching the image and padding it with black pixels. But I did transform them into squares.

1 Like

Hi @faib,
I am not sure if the original repo has corrected the mistake that you mentioned about visualizing anchor boxes.
Can you please confirm if the following code is correct.

fig,ax = plt.subplots(figsize=(15,15))
ax.imshow(image2np(data.valid_ds[3][0].data))

for i, bbox in enumerate(anchors[:1]):
bb = bbox.numpy()
x = (bb[0] + 1) * size / 2
y = (bb[1] + 1) * size / 2
w = bb[2] * size / 2
h = bb[3] * size / 2

rect = [x,y,w,h]
draw_rect(ax,rect)