Hi all,
Okay this might be a silly question but I’m a noob so I’m gonna go ahead and ask.
How do you read this plot?
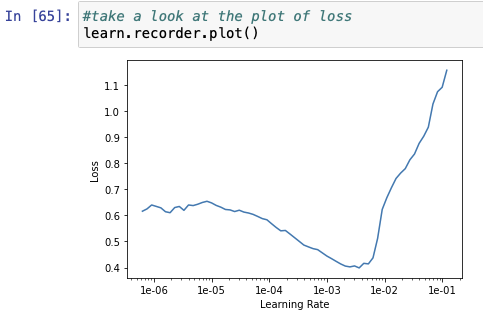
For example, how do you read the x axis to figure out what value corresponds to the lowest loss?
Hi all,
Okay this might be a silly question but I’m a noob so I’m gonna go ahead and ask.
How do you read this plot?
For example, how do you read the x axis to figure out what value corresponds to the lowest loss?
You can somewhat reproduce that graph by using the following line - although you might need to play with the scales.
plt.plot(learn.recorder.lrs, learn.recorder.losses)
From learn.recorder.losses you can find the minimum value of the loss using the min() method. However, more important than that, is finding a good learning rate for training. As said in the first lessons, good learning rates are the ones that have the greatest negative slope. For your example graph, that would be around 1e-3.
Did I explain myself well?
Thanks for the explanation! I was actually trying to actually figure out how to read that plot. As in, how do you could those little ticks on the axis and what value each tick represents.
Also, I thought the best learning rate would be where the loss is at a minimum? In this case, somewhere a little to the right of 1e-03
While having plots is useful, if you have the list of the losses, why not using them to get exactly the minimum value?
The learning rate with the lowest loss is not the one you would want to choose. A more detailed explanation is given in the following blog post
I understand what you’re saying. I’m not concerned with the learning rate really but I’m just trying to understand how to read a graph like this because I have no idea how to read the x-axis  what is the value of each tick between 1-e03 and 1-e02?
If you really want to just use the graph, you could use a pixel ruler and count how many pixels are equal to a tick.
@avngr
You must have seen a linear scale ruler usually, where we have 0,1,2,3…and then between every two numbers are equally spaced numbers. For example, 0 and 1 have 9 equally spaced numbers between them - 0.1,0.2,0.3 and so on till 0.9.
This is a different kind of ruler. Its called a logarithmic scale ruler. Here, numbers are not in linear series(like 0, then 0+1 = 1, then 1+1= 2, then 2+1=3, and so on) but in multiplicative series. So, 1e-06 means 10^-6(e means 10 in python!) (or 0.000001), and to get to the next point, you would not add 1, but multiply by a certain number. That number is 10. so you multiply 10^-6 by 10 to get 10^-5 (or 0.00001), and then multiply 10^-5 by 10 to get 10^-4, and so on.
This kind of scale is used when the range of values to be covered span a range of orders of magnitudes. Here, the scale goes from 1e-6 (even less than that) to 1e-1. Thats 0.000001 to 0.1. Imagine marking them on a usual linear scale ruler. You’d have to mark 0.000001, 0.000002, 0.000003. It would seem to ever end! You can’t mark 100000 values on a single graph. So they use this graph.
Just like in linear scale, values between two numbers are equally spaced number, here the values between two numbers are equally spaced by multiplication. So, between 10^-6 and 10^-5 are 10^-5.9, 10^-5.8, 10^-5.7 till 10^-5.1 (they may seem weird to us, but the computer can compute them). Each of these numbers is a result of multiplying the previous number by 10^0.1.
If you’re familiar with the logarithmic function. This is basically a linear scale of the log of all these numbers with respect to the base 10. so log10(10^-6) = -6, log10(10^-5) = -5, and so on, and the logs themselves would be in linear scale (-6+1 = -5, -5+1 = -4, and so on, and between -6 and -5 would be 9 equally spaces points, -5.9, -5.8, -5.7 and so on)
Thank you so much for taking the time to write this out ! this is exactly what I was looking for. I get it now 