I’m using a RF to forecast sales. I’m trying to do feature selection eliminating the least imporant ones, as in Lesson 3. I’m using 50k rows for training and ~44k for validation.
I made a loop that iterates over a list of minimum importances, selects features with an importance greater than each minimum, trains a model and prints the scores. Then I put the results into this DataFrame:
The MSLE and R2 scores on the validation set appear to be correlated, when the opposite thing should make more sense (The R2 score should generally improve when the MSLE goes down). What is this happening? Sould I use a value for set_rf_samples bigger, a validation set with less data (this doesn’t seem like a good idea either…)?
        Num_columns	Train_MSLE	Validation_MSLE	Train_R2	Validation_R2	OOB_score	Minimum_importance
    0	15	0.30372	0.41809	0.93718	0.86126	0.90515	0.0100
    1	20	0.28309	0.41454	0.94523	0.86415	0.91697	0.0050
    2	56	0.27084	0.41154	0.94987	0.85734	0.92448	0.0010
    3	98	0.25625	0.42543	0.94944	0.87004	0.92359	0.0005
    4	245	0.24464	0.42120	0.95016	0.86400	0.92492	0.0001
    5	265	0.24605	0.43766	0.94809	0.87276	0.92173	0.0000

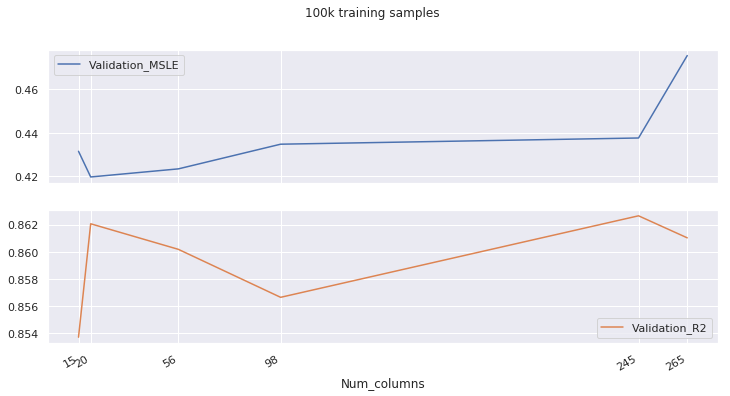
Now, when using 100k samples this doesn’t happen. But still, weird things happen, like the second best R2 score being achieved when the Mean Squared Log Error is the biggest. I’m not sure wether this information is useful or not, and those MSLE and R2 scores are significant or not.
    Num_columns	Train_MSLE	Validation_MSLE	Train_R2	Validation_R2	OOB    _score	Minimum_importance
0	15	0.22323	0.43150	0.96273	0.85367	0.91315	0.0100
1	20	0.20665	0.41975	0.96813	0.86206	0.92534	0.0050
2	56	0.19495	0.42345	0.97112	0.86017	0.93221	0.0010
3	98	0.18358	0.43474	0.97143	0.85662	0.93282	0.0005
4	245	0.17602	0.43758	0.97169	0.86265	0.93376	0.0001
5	265	0.17561	0.47529	0.97151	0.86102	0.93291	0.0000
Thanks!