Question about Lesson 6 Rossman input column variables

I went over the rossman_data_clean notebook and with the help of the video from the machine learning course was able to fairly understand both the preprocessing step and the reasoning behind them. However, when it comes to actually training the model, I find that several columns of the dataset are not actually used to build the model.

In particular, we define a set of categorical and continuous variables and only the values in these columns are actually used in the training as shown here:

cat_vars = ['Store', 'DayOfWeek', 'Year', 'Month', 'Day', 'StateHoliday', 'CompetitionMonthsOpen',
    'Promo2Weeks', 'StoreType', 'Assortment', 'PromoInterval', 'CompetitionOpenSinceYear', 'Promo2SinceYear',
    'State', 'Week', 'Events', 'Promo_fw', 'Promo_bw', 'StateHoliday_fw', 'StateHoliday_bw',
    'SchoolHoliday_fw', 'SchoolHoliday_bw']

cont_vars = ['CompetitionDistance', 'Max_TemperatureC', 'Mean_TemperatureC', 'Min_TemperatureC',
   'Max_Humidity', 'Mean_Humidity', 'Min_Humidity', 'Max_Wind_SpeedKm_h', 
   'Mean_Wind_SpeedKm_h', 'CloudCover', 'trend', 'trend_DE',
   'AfterStateHoliday', 'BeforeStateHoliday', 'Promo', 'SchoolHoliday']

dep_var = 'Sales'
df = train_df[cat_vars + cont_vars + [dep_var, 'Date']].copy()

The number of columns actually used is 38 while the original dataset had 93 columns. Am I understanding this correctly? If this is true, why are we not using the other columns?

I’m particularly interested in understanding why we are discarding the information given to us by add_datepart such as is_year_end etc.

I remember vaguely something from DL1 lesson 4 that these variables were selected by the 3rd place winner of the Rossmann competition using some kind of “variable importance”, but I can’t find that particular reference. Will update when found.

I think this is where jeremy mentioned it (but no mention of variable importance, weird)

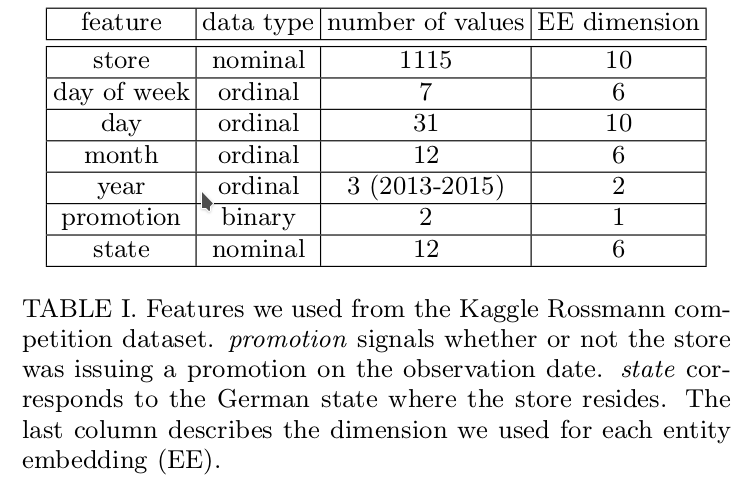
I’ve attached a table from the 3rd place winner’s paper which highlights the features they say they used for the competition. They mention that while they used other data as well, they only concentrate on these for the paper. They don’t actually talk about features such as CompetitionOpenSinceYear, SchoolHoliday_bw. I’m curious whether those are something that Jermey did as extra (which is great!). I’m curious as to why the features returned by add_datepart are not utilized at all. Furthermore, a bunch of continuous features are not used as well. Here is a list difference of the features:

cols={'elapsed', 'is_month_start', 'week', 'file_de', 'is_quarter_start', 'min_temperaturec', 'competitionopensinceyear', 'competitionopensince', 'customers', 'day', 'trend_de', 'promo2days', 'year', 'precipitationmm', 'is_month_end_de', 'afterpromo', 'state', 'promo2since', 'promo_fw', 'is_month_end', 'max_visibilitykm', 'date', 'schoolholiday_fw', 'mean_sea_level_pressurehpa', 'promo2', 'week_de', 'winddirdegrees', 'month_de', 'meandew_pointc', 'open', 'mean_humidity', 'cloudcover', 'is_year_start', 'stateholiday', 'min_humidity', 'max_gust_speedkm_h', 'competitiondaysopen', 'stateholiday_fw', 'competitionopensincemonth', 'beforepromo', 'promo', 'is_quarter_end', 'statename', 'file', 'storetype', 'is_year_end_de', 'schoolholiday', 'dayofyear_de', 'competitionmonthsopen', 'afterschoolholiday', 'schoolholiday_bw', 'store', 'month', 'index', 'afterstateholiday', 'beforeschoolholiday', 'is_year_end', 'mean_wind_speedkm_h', 'promo_bw', 'promo2weeks', 'trend', 'dayofweek_de', 'assortment', 'state_de', 'min_visibilitykm', 'min_dewpointc', 'mean_visibilitykm', 'promo2sinceweek', 'dayofweek', 'dayofyear', 'elapsed_de', 'date_de', 'competitiondistance', 'is_quarter_start_de', 'is_month_start_de', 'dew_pointc', 'promo2sinceyear', 'mean_temperaturec', 'is_quarter_end_de', 'is_year_start_de', 'events', 'max_humidity', 'promointerval', 'max_wind_speedkm_h', 'day_de', 'stateholiday_bw', 'max_sea_level_pressurehpa', 'beforestateholiday', 'min_sea_level_pressurehpa', 'max_temperaturec'}

used={'storetype', 'schoolholiday_fw', 'schoolholiday', 'dayofweek', 'week', 'competitionmonthsopen', 'min_temperaturec', 'schoolholiday_bw', 'store', 'competitiondistance', 'mean_humidity', 'competitionopensinceyear', 'cloudcover', 'month', 'day', 'stateholiday', 'promo2sinceyear', 'afterstateholiday', 'mean_temperaturec', 'min_humidity', 'trend_de', 'mean_wind_speedkm_h', 'year', 'promo_bw', 'promo2weeks', 'trend', 'events', 'max_humidity', 'stateholiday_fw', 'promointerval', 'max_wind_speedkm_h', 'stateholiday_bw', 'promo', 'assortment', 'beforestateholiday', 'state', 'promo_fw', 'max_temperaturec'}

cols-used
{'date', 'is_year_end_de', 'mean_visibilitykm', 'promo2sinceweek', 'dayofyear_de', 'mean_sea_level_pressurehpa', 'promo2', 'elapsed', 'week_de', 'is_month_start', 'winddirdegrees', 'dayofyear', 'elapsed_de', 'afterschoolholiday', 'file_de', 'month_de', 'is_quarter_start', 'date_de', 'meandew_pointc', 'open', 'is_quarter_start_de', 'competitionopensince', 'is_year_start', 'is_month_start_de', 'customers', 'index', 'dew_pointc', 'beforeschoolholiday', 'promo2days', 'is_year_end', 'precipitationmm', 'is_quarter_end_de', 'max_gust_speedkm_h', 'is_year_start_de', 'competitiondaysopen', 'is_month_end_de', 'competitionopensincemonth', 'beforepromo', 'afterpromo', 'day_de', 'dayofweek_de', 'max_sea_level_pressurehpa', 'state_de', 'min_sea_level_pressurehpa', 'is_quarter_end', 'promo2since', 'is_month_end', 'statename', 'min_visibilitykm', 'min_dewpointc', 'max_visibilitykm', 'file'}

Seems like the rossmann authors used somewhat similar variables for the actual Kaggle competition, as shown in their github here, although how they selected them in the first place is ?.

I suspect functions such as add_datepart in the notebook could have created variables, though useful in many other contexts, that were more than what the rossmann authors used, hence quite a few of them have to be culled.

I am just guessing …

In another course, we studied the ‘feature importance’ of each feature while calculating the solution (our dependent variable). I remember that we would ‘cut out’ everything that was not too important to improve generalization = avoid overfitting. [1]

That was using random forests but similar analysis could be done for NN (Neural Networks).

I assume he did such analysis and decided not to take ‘all in’ to allow the model to focus on less variables and their interactions.

Here is an example

which comes from here

About the “year end”. If you know that the test set is just the next weeks and that does not cover a change of year, then it is useless for your case. Imagine that you had a column with “Customer speaks 3+ languages”: True/False. Would you use it on your NN ?

In many places they teach you to “laser focus” on the task at hand. In kaggle your task is to excel in predicting the test set (public and private). Everything else is irrelevant (for the competition).

[1] This was well demonstrated in a competition where his model was jumping many places up from the public to the private leaderboard, and that happened because his model was not overfitted to the public test set and was able to generalize well to ‘new unseen data’.