I’m having difficulty understanding what the author is talking about.
What is the plateau they’re talking about? (is that the drop and plateau in the first picture? )
Is the right one under fitting and left one is not?
The rest of the paper is pretty concise and understandable, just this part is super confusing, especially all those are test loss, and they’re not compared to training loss.
It’s a mistake. I emailed Leslie Smith and he said that there was a mistake in the paper, that he said resnet-50 decreases more and becomes more horizontal where he meant inception-resnet-v2. He was out of town and will fix it when he gets back in a few days.
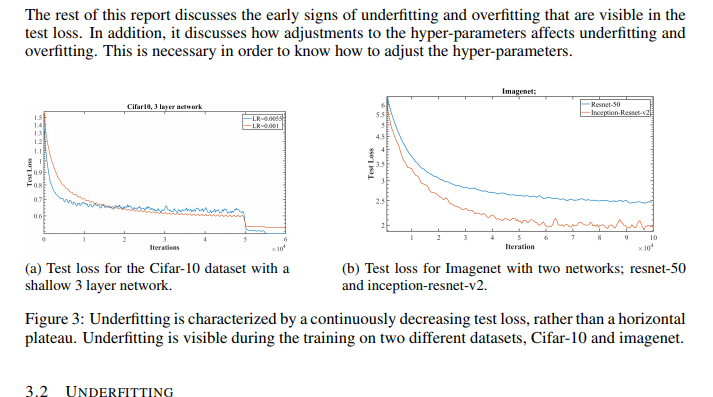
In Figure 3b the test loss continues to decrease over the 100,000 iterations (about 3 epochs) but the inception-resnet-v2[fixed; paper was wrong] decreases more and becomes more horizontal, indicating that the inception-resnet-v2 has less underfitting.
So in Fig 3b, he’s saying that the red line drops farther and then pretty much stops moving. (I eyeball the plateau in 3b to happen at around iteration 6 or 7.) The blue line in 3b doesn’t plateau – it keeps on going down, down, down. It’s STILL going down at iteration 10.
In Fig3a, the blue line goes down faster than the red line, and then sort of sits at 0.7. It doesn’t really move. The red line goes down slower, and it keeps going down. It’s slow, but it really is still going down, even when it gets to iteration 5.
In figure 3a, I don’t know what happens at iteration 5, but I don’t think that’s what he’s talking about. I’d ignore the stuff after iteration 5.
Somehow, the fact that we were not underfitting on the blue curve (cause it plateaued and became horizontal!) is an indication that we are on the right track and will arrive at a better result at the end of the training.
INSANE.
INSANELY GOOD
I only started reading the paper but this is what Leslie Smith seems to be saying. To further drive the idea home he states:
I kept rereading those first couple of pages several times cause I couldn’t understand what was happening there. My understanding was that if we train with too small of an lr -no big deal. We just need to train for a little while longer. In extreme case, we might have to train for way, way longer but the crucial point was that the loss is decreasing so that should be good, right? A loss that plateaus is indicative of using too high of a learning rate… But apparently not!
Maybe I am not reading this right. But if I am - this is mind blowing. Knowing this basically gives you superpowers. And it is only 4 pages into the paper
I’m also having trouble with the first couple of pages, but I can see there’s some big new insights there… One key question I have is - how does he do the LR finder and show the test loss as well? I guess he’s just running a batch from the test set through the model (forward only, of course) every time he runs a batch from the train set through?
If that’s all it is, I think it would be a really valuable addition to fastai for someone to modify lr_find to do this, and to see if you can replicate the plots from this section of the paper.