This might be a silly question, but how do we actually tell if we’re using the GPU with as much efficiency as possible? So far I’ve only looked over in nvidia-smi dmon, which shows things like sm/memory usage and power consumption, but does sm at 100% mean the GPU is actually busy computing? I’m asking since for CPUs it generally counts as busy-time if the CPU is waiting for memory accesses.
For example, training on 2000 images of cats&dogs with 300 images in validation set, measuring time per 1 epoch
- batch 2: time: 34s
- batch 4: time: 29s
- batch 8: time 29s
- batch 16, time: 30s
- batch 32, time: 32s
- batch 64: time: 37s
- batch 128: time: 40s … this time at first run I had SM usage jump back and forth between 60-100%, run out of memory at the end, and when I restarted it, it ran continuously at 100% until the validation phase
- batch 256: doesn’t work, OOMs every time
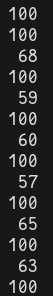
Here’s a screenshot of the SM % usage on the batch 128 run. In all of the other runs the GPU was mostly at 100%, almost never dropping below 90-95%.
Looking at the results, this goes against what I’ve heard, that bigger batches are faster. It seems like it should be the case, I mean otherwise the GPU is just slacking waiting for the next data to come in, right?
How can I get some more insight into what is really going on? Is there a way to get more precise measurements, such as the perf_tools but for GPUs? Or is there some good way to for example correlate CPU/GPU usage to see if one is waiting for the other?
This was measured on GeForce 1080ti with 11GB VRAM and i7-5820k with TensorFlow backend.