I’ve just been working on a multi-class segmentation problem (Kaggle Steel Defect Detection).
To test my predictions against the ground truth masks I’ve been using Learner’s ‘show_results’, which overlays the mask on top of the associated image. I thought things were going pretty badly when I got this coming out:
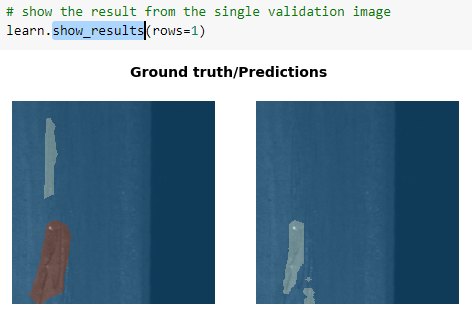
From this it appears that it’s completely missed one area of defect and mis-classified the other (in the ground truth the brown area is defect category 1 and grey area is defect category 2). So it looks as if it has wrongly predicted the area that should be category 1 as category 2. Except it hasn’t…
It has actually predicted the class correctly, but ‘show_results’ (or rather the underlying matplotlib used to draw the images) starts indexing into its colour map using the values of the supplied image. Since the prediction doesn’t contain any pixels that belong to category 1, category 2 is assigned to the first colour map value. So the colours used don’t match up with those used for the ground truth.
I assume this would also apply to any missing categories other than the first, e.g. if the ground truth has categories {1,2,3,4,5} but the prediction only has {2,4} then the prediction will end up being displayed with the colours that are shown for categories 1,2 in the ground truth. Obviously this makes things very confusing! (and indeed it has taken me a long time to track this down, since I thought the issue was in my model).
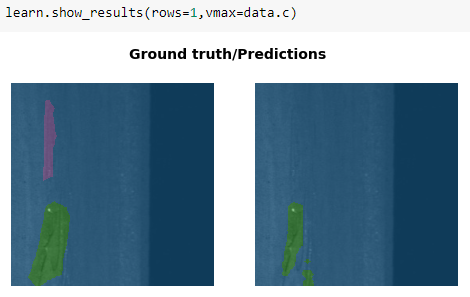
To fix this, the matplotlib ‘vmax’ property can be supplied as a parameter of ‘show_results’. If this is set to the number of categories in the classification then this seems to work:
However, a better fix would be if the ‘show_results’ function itself supplied the ‘vmax’ value set to the number of classes. This could be done by adding a vmax parameter to the call of ‘show_xyzs’ in the ‘show_results’ function:
ds.x.show_xyzs(xs, ys, zs, vmax=ds.c, **kwargs)