For lesson 1 image classification I got the following error rate when labelling an image as ‘sleeve visible’ or ‘sleeve not visible’.
epoch
train_loss
valid_loss
error_rate
time
0
0.262874
0.666945
0.300000
00:01
1
0.233428
0.627551
0.200000
00:01
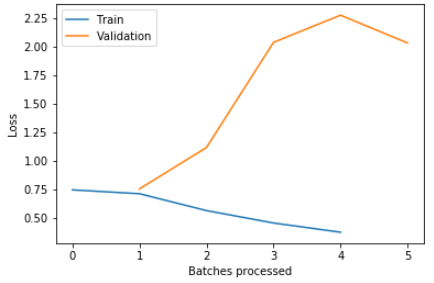
I’d like to replicate this (admittedly poor) performance, but using the multi label approach. However, I get the following validation loss when I do. Does anyone know what I’m doing wrong?
I looked at your notebook and I don’t get the reason why you are speaking about multilabel classification ? To me it looks like you only have two labels: Visible or notVisible and you images can only be one of them, so it seems that it is classic monolabel classification.
Also, the increase in the validation loss could be the result of a learning rate too high, maybe try to reduce it by 3 or 5 and tell me how it behaves.
Thanks for the reply. I am just starting with two labels, to get it working. Ultimately I will apply many labels.
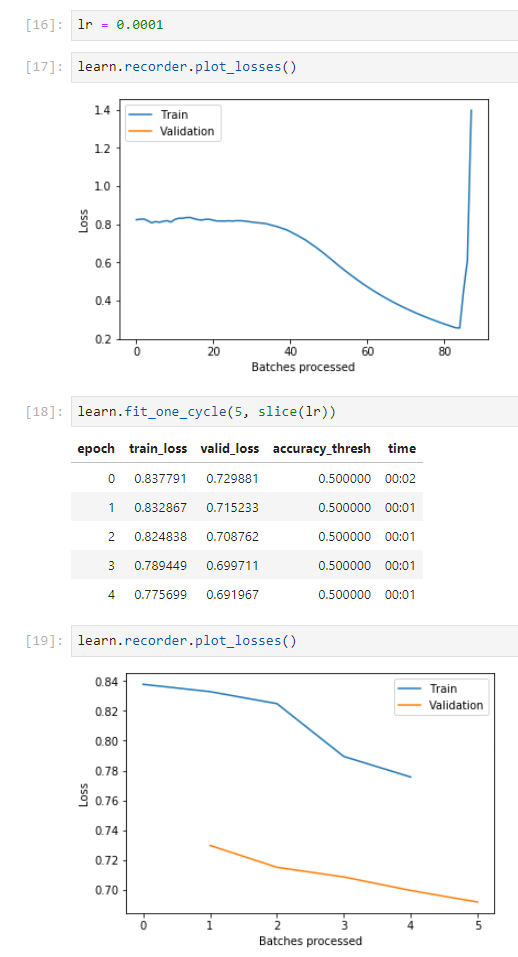
By reduce by 3 or 5, do you mean reduce line 16 lr from 0.01 to 0.0001 or 0.000001? Or do you mean line 18 learn.fit_one_cycle(5, slice(lr)) and change it to 2 or 0? Thanks
Just to clarify, when you add more labels, it will be multi-class and not multi-label. Multi-label is when each image has more than one label as output. Cheers
Hey, I just saw your notebook. Some observations:
.
Why are you using acc_02 as the metric for binary classification? Use it when you turn it to multilabel classification. Right now you can go for accuracy or error_rate.
Also you’ve chosen the wrong LR. When you do learn.recorder.plot() it plots the learning rate vs the error. You want to select the slice that reduces the error the most (downward slope) and not the lowest point. In cell 15 try lr between 1e-3 and 1e-2.
plot the heatmap to see if your model is picking up the right things in the image.
Also see if you have enough data, get more if you can. Did you curate the dataset yourself?