I have tried using learn.recorder.plot_metrics() but get the following error:
ModuleAttributeError: ‘Sequential’ object has no attribute ‘plot_metrics()’
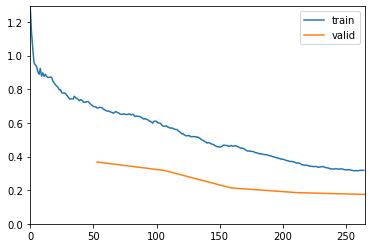
I am trying to plot a similar graph to this in order to help me choose which epoch to stop to prevent overfitting:

I have tried using SaveModelCallBack() as well, but cannot include accuracy along w/ valid and train loss?
Thank you!!