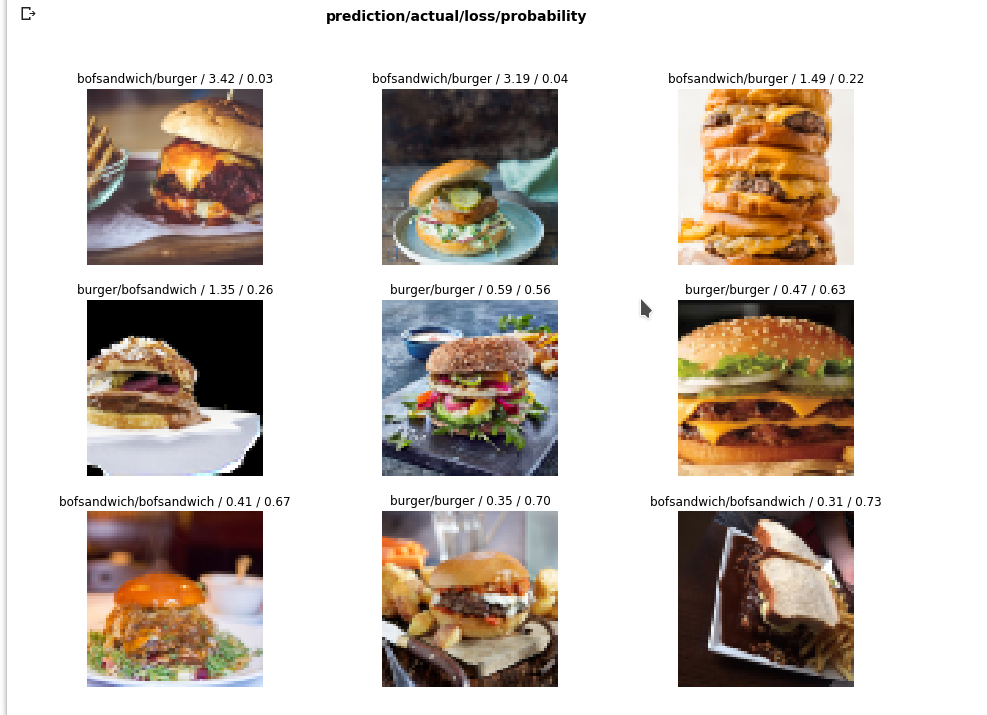
I was trying to use the material from lesson 1 to create a binary image classifier to identify burger or bofsandwich (a danish variation of a burger). Results we’re okay, but one thing that I found wierd is that when I use plot_top_losses, it shows me some images that was correctly classified, which I don’t get as it should only show errors:
I’m not sure but I think it will show the images with high loss. When your model is too good so the majority of the classification is good, then it will show also the good classification (high loss but still classify correctly)
My guess is that you’re seeing the data with the highest loss function value, independent of correct or incorrect categorization. The loss function is what you’re trying to minimize. You can roughly think of the loss function as a mathematical representation of how far off your model’s prediction is from the actual, ground-truth, label.
A loss function value greater than 0 just means the model wasn’t 100% sure it was a burger or a bofsandwich. Or, put in another way, the prediction didn’t exactly match the label.