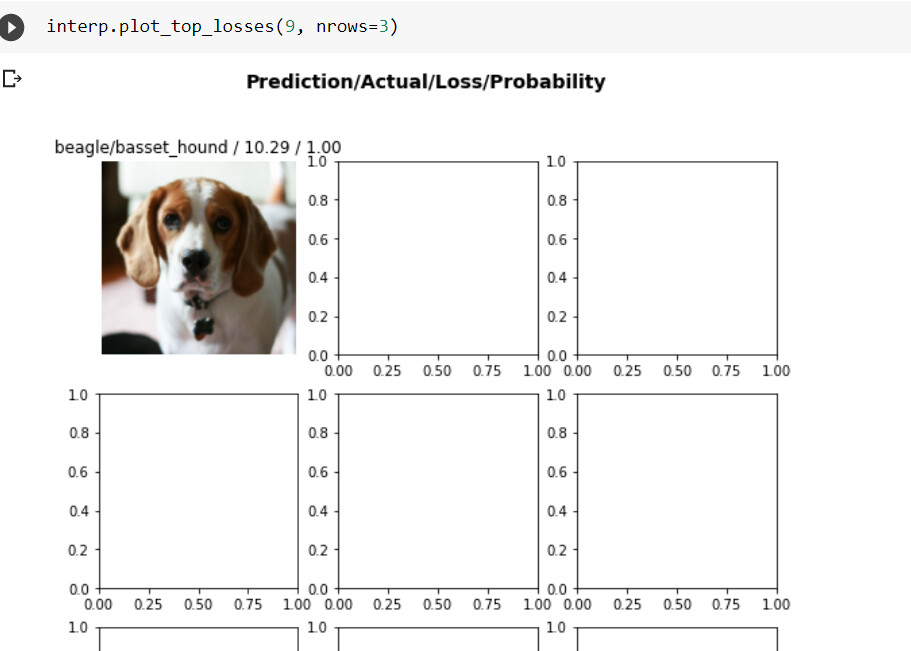
Plot top losses has always worked great for me, but as of this morning I’ve noticed a problem:
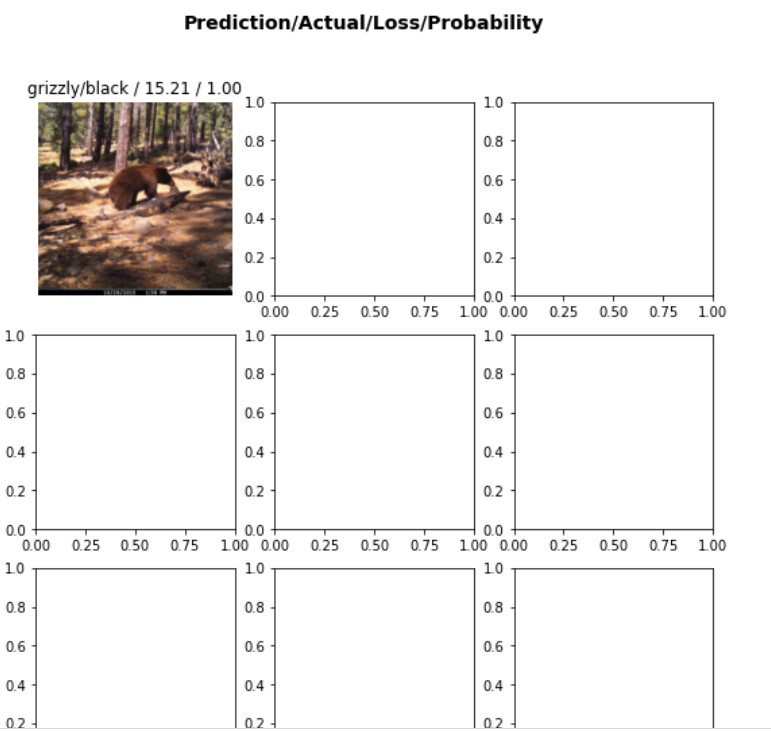
The first picture shows correctly and then the rest of my grid just shows empty graphs. Any idea what is going on here or when it might be fixed?
Plot top losses has always worked great for me, but as of this morning I’ve noticed a problem:
The first picture shows correctly and then the rest of my grid just shows empty graphs. Any idea what is going on here or when it might be fixed?
do you have it in a colab you can share?
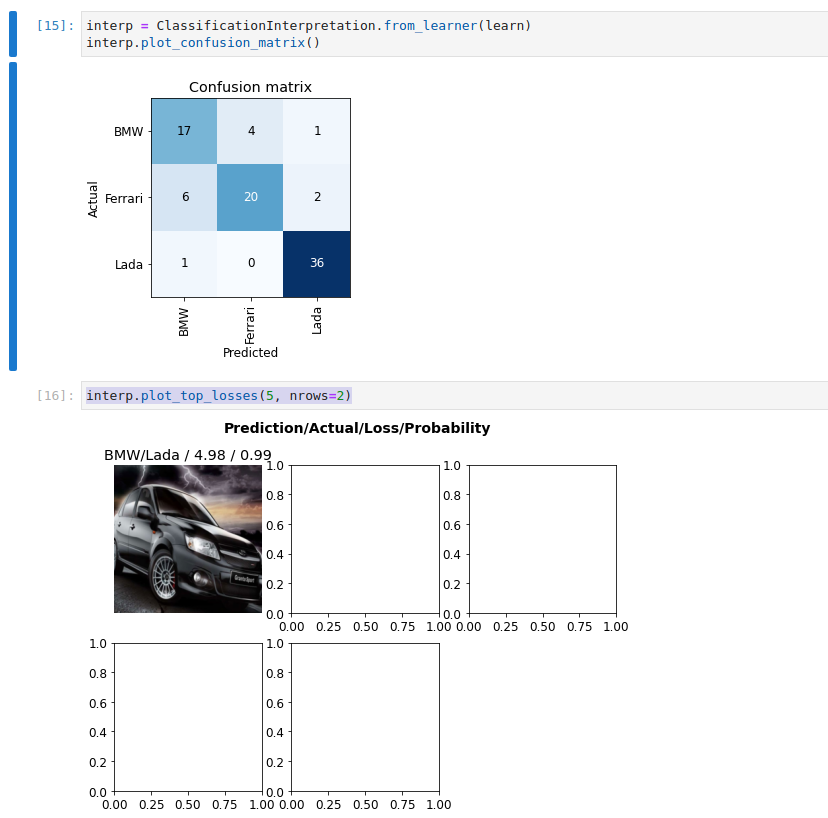
It’s like this in all of my notebooks now. Someone else actually tipped me off to the problem. Here’s an example I just built off of fast.ai’s Google Colab NB5:
Other interpreter functions, most_confused and confusion_matrix work great! Top losses is the only one broken.
Thanks,
Alex
Thanks guys, made Jeremy aware of this issue. Hopefully gets resolved soon 
Here’s the previous working version if you want to temporarily use it.
def plot_top_losses(self, k, largest=True, **kwargs):
        losses,idx = self.top_losses(k, largest)
        if not isinstance(self.inputs, tuple): self.inputs = (self.inputs,)
        if isinstance(self.inputs[0], Tensor): inps = tuple(o[idx] for o in self.inputs)
        else: inps = self.dl.create_batch(self.dl.before_batch([tuple(o[i] for o in self.inputs) for i in idx]))
        b = inps + tuple(o[idx] for o in (self.targs if is_listy(self.targs) else (self.targs,)))
        x,y,its = self.dl._pre_show_batch(b, max_n=k)
        b_out = inps + tuple(o[idx] for o in (self.decoded if is_listy(self.decoded) else (self.decoded,)))
        x1,y1,outs = self.dl._pre_show_batch(b_out, max_n=k)
        if its is not None:
            #plot_top_losses(x, y, its, outs.itemgot(slice(len(inps), None)), L(self.preds).itemgot(idx), losses,  **kwargs)
            plot_top_losses(x, y, its, outs.itemgot(slice(len(inps), None)), self.preds[idx], losses,  **kwargs)
        #TODO: figure out if this is needed
        #its None means that a batch knows how to show itself as a whole, so we pass x, x1
        #else: show_results(x, x1, its, ctxs=ctxs, max_n=max_n, **kwargs)
#can use by passing in your interp obj like so…
plot_top_losses(interp, 9, nrows=3)
This is fixed in https://github.com/fastai/fastai/pull/3510 so it should work again in the next release. Alternatively you could also install the dev version of fastai for the fix.
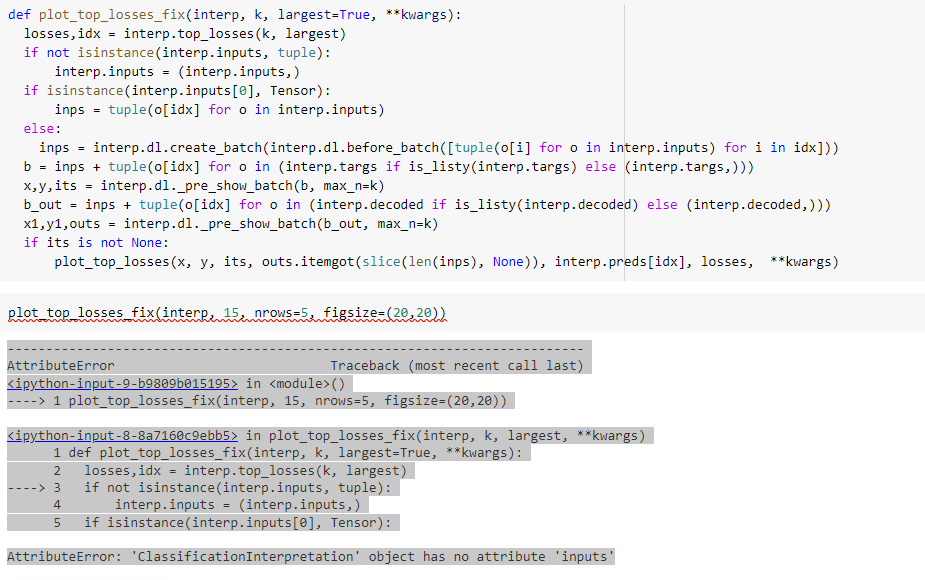
Please give an example of how the fix is to be used. I tried to use plot_top_losses I received the following:
TypeError: plot_top_losses() takes from 2 to 3 positional arguments but 6 were given.
my input to interp.plot_top_losses which received the error: interp.plot_top_losses(21, nrows=7, figsize=(18,20))
should be changed to what in plot_top_losses?
Hi! I’ve tried this same as @henry but it didn’t work. Would like to know how to implement this!
I still have the same issue.
I fixed it with this:
I redefined the function:
def plot_top_losses_fix(interp, k, largest=True, **kwargs):
        losses,idx = interp.top_losses(k, largest)
        if not isinstance(interp.inputs, tuple): interp.inputs = (interp.inputs,)
        if isinstance(interp.inputs[0], Tensor): inps = tuple(o[idx] for o in interp.inputs)
        else: inps = interp.dl.create_batch(interp.dl.before_batch([tuple(o[i] for o in interp.inputs) for i in idx]))
        b = inps + tuple(o[idx] for o in (interp.targs if is_listy(interp.targs) else (interp.targs,)))
        x,y,its = interp.dl._pre_show_batch(b, max_n=k)
        b_out = inps + tuple(o[idx] for o in (interp.decoded if is_listy(interp.decoded) else (interp.decoded,)))
        x1,y1,outs = interp.dl._pre_show_batch(b_out, max_n=k)
        if its is not None:
            #plot_top_losses(x, y, its, outs.itemgot(slice(len(inps), None)), L(self.preds).itemgot(idx), losses,  **kwargs)
            plot_top_losses(x, y, its, outs.itemgot(slice(len(inps), None)), interp.preds[idx], losses,  **kwargs)
        #TODO: figure out if this is needed
        #its None means that a batch knows how to show itself as a whole, so we pass x, x1
        #else: show_results(x, x1, its, ctxs=ctxs, max_n=max_n, **kwargs)
And using the command below I can now plot the top losses:
plot_top_losses_fix(interp, 10, nrows=2)
Hope this helps for the people who have still the same problem.
thanks.
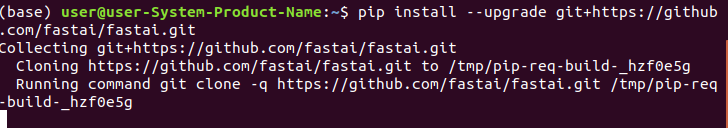
Also as it is fixed in the current github repo can install dev version in colab from there.
# in colab.
!pip install --upgrade git+https://github.com/fastai/fastai.git
Thank You All!
Just scratched my head with this problem. Being a newbee everything is really scary. No I might get through page one.
Did you try from github?
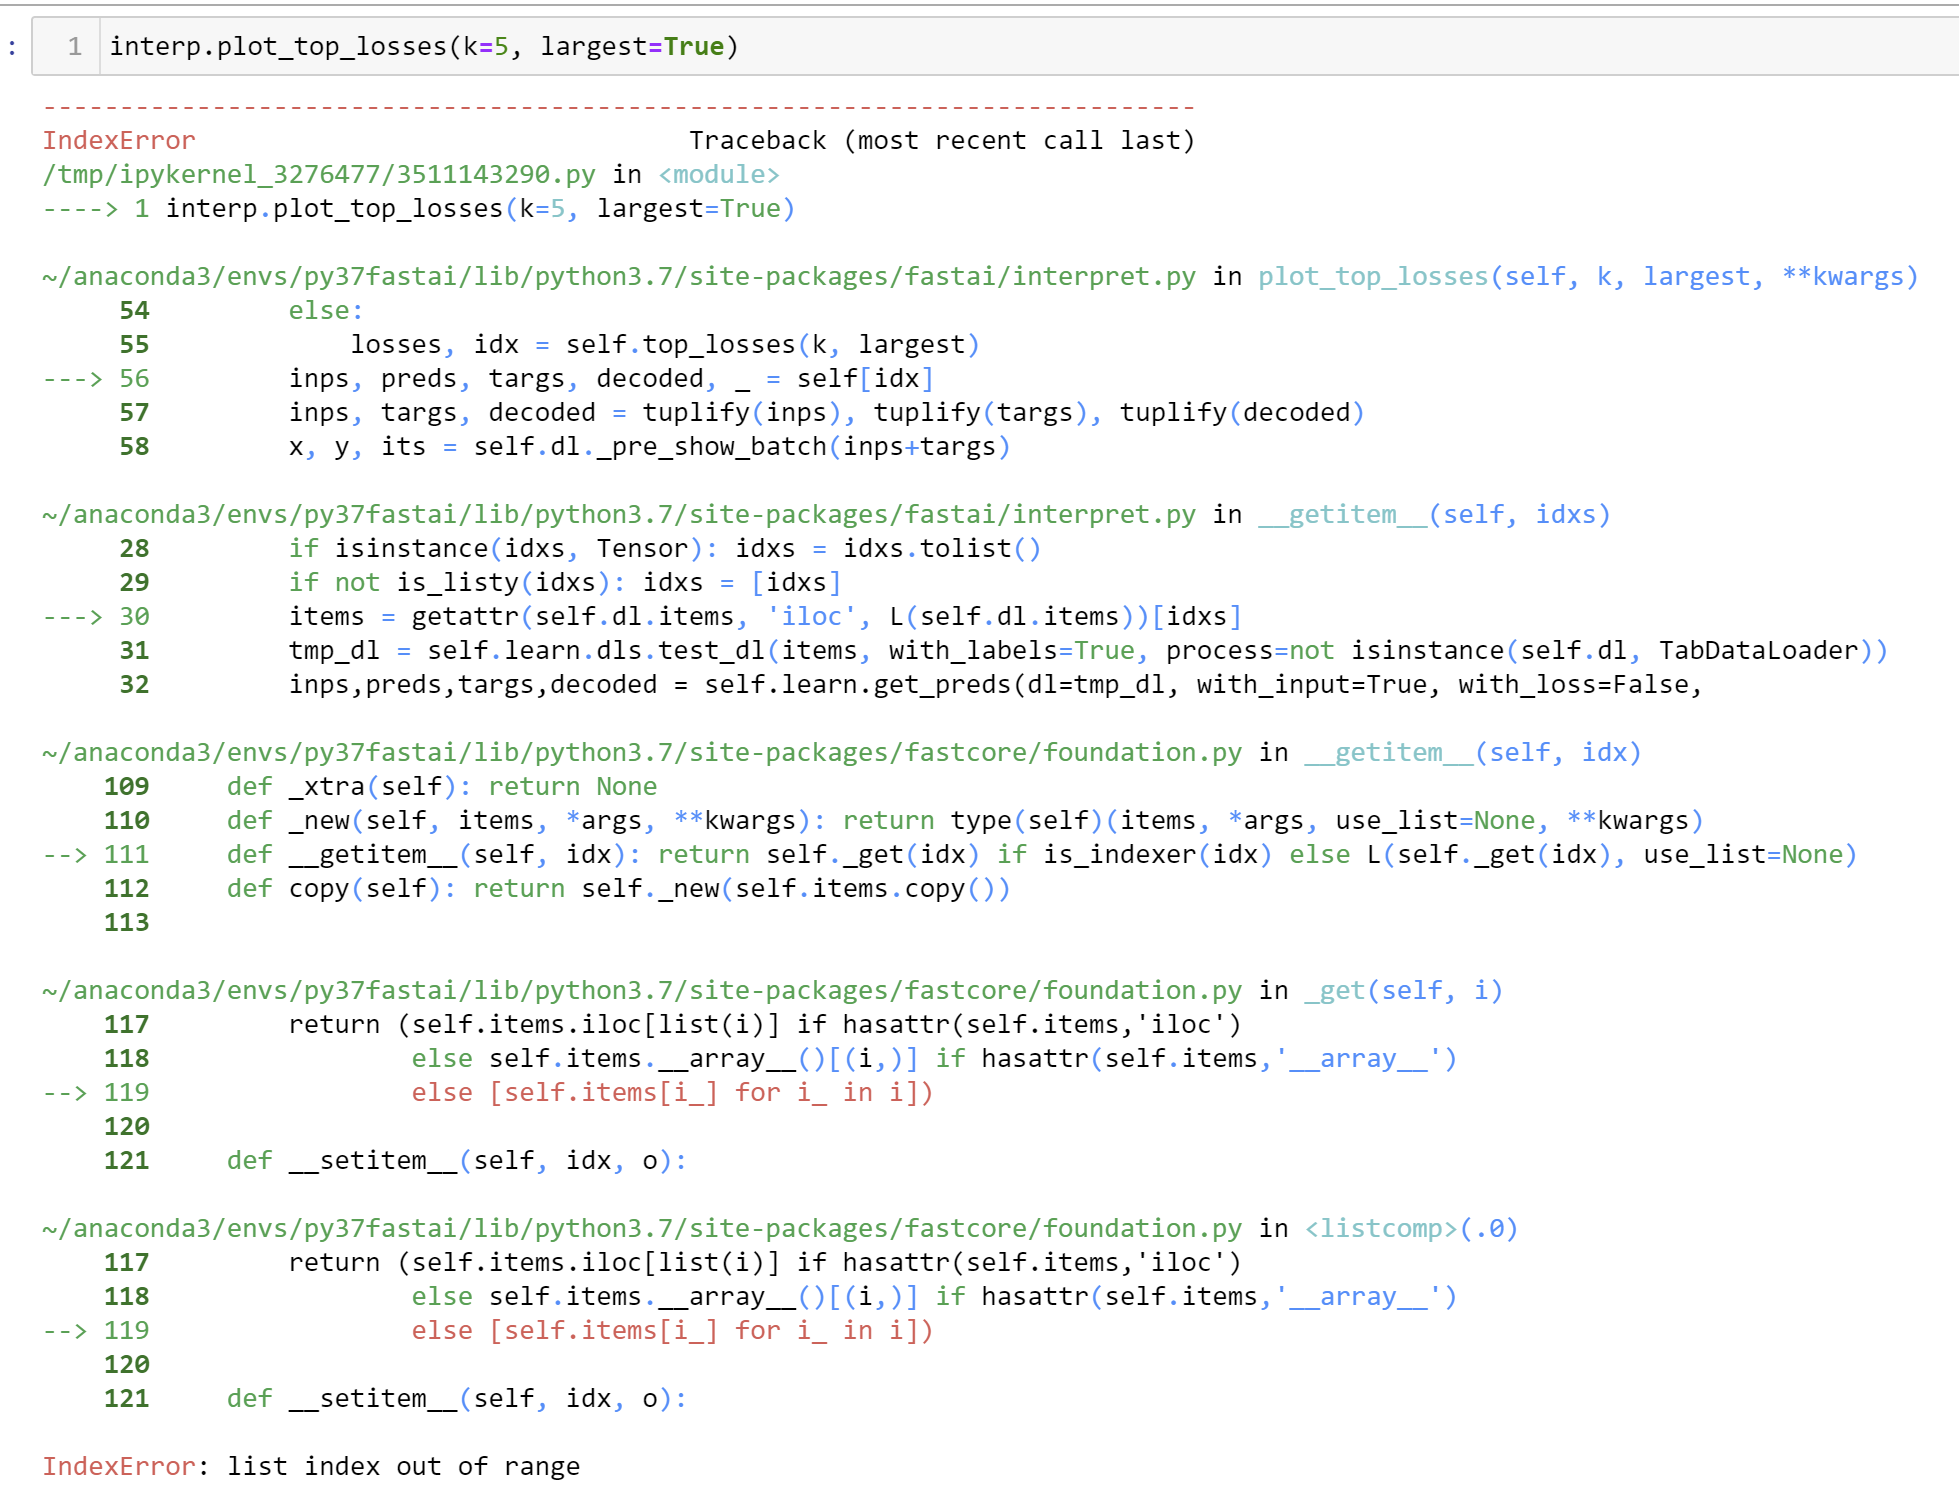
I installed the upgrade and now it doesn’t seem to work at all. Before, it just plotted the first sample, as described above.
Edit: There are more than 5 samples in the test set and yes, it’s the same error for k=1, as well.
self.items is a len()=1 list that contains an array with all the file_paths from which data is read from.
It should try to get self.items[0][i_], but it doesn’t. Not sure how to solve this. Will revert to an older version for now.
Edit:
I just wanted to tell you that the solution by Valentino et al. works flawlessly for me. I’m wondering, why the updated fastai doesn’t work.
Thank you @valentino it worked for me.