Hi! Sorry if something like this has been posted already, I searched around and didn’t find anything.
I wanted to visualize performance similarly to ClassificationInterpretation.plot_top_losses while working on a cat facial features dataset: https://www.kaggle.com/crawford/cat-dataset Here’s what I came up with:
# Visualize worst predictions of the validation set for a PointsItemList learner
def worst_preds(learner, points_per_image=1, limit=5, figsize=(20,20)):
    preds, y, losses = learner.get_preds(with_loss=True)
    ds = learner.data.valid_dl.dataset
    # The network output is a flat list of losses for each coord of each point,
    # so to get the loss for each image we cut the output into groups of size
    # 2*points_per_image and average
    unflat_losses = [torch.mean(losses[2*points_per_image*i:2*points_per_image*(i+1)]) for i in range(len(y))]
    # Sort from worst to best
    worst_idxs = np.argsort(unflat_losses)[::-1]

    fig,axs = plt.subplots(limit,2, figsize=figsize)
    fig.suptitle("Actual/Predicted")

    for j in range(limit):
        worst_pred = preds[worst_idxs[j]].view(-1,2)
        worst_img = ds[worst_idxs[j]][0]

        # TODO get title to be over both images
        worst_img.show(ax=axs[j][0], y=ds[worst_idxs[j]][1],
                       title=str(learner.data.valid_dl.dataset.items[worst_idxs[j]]) + ', loss=' + str(unflat_losses[j].item()))
        worst_img.show(ax=axs[j][1], y=ImagePoints(FlowField(worst_img.size, worst_pred), scale=False))
Example:
worst_preds(learn, points_per_image=9, limit=4)
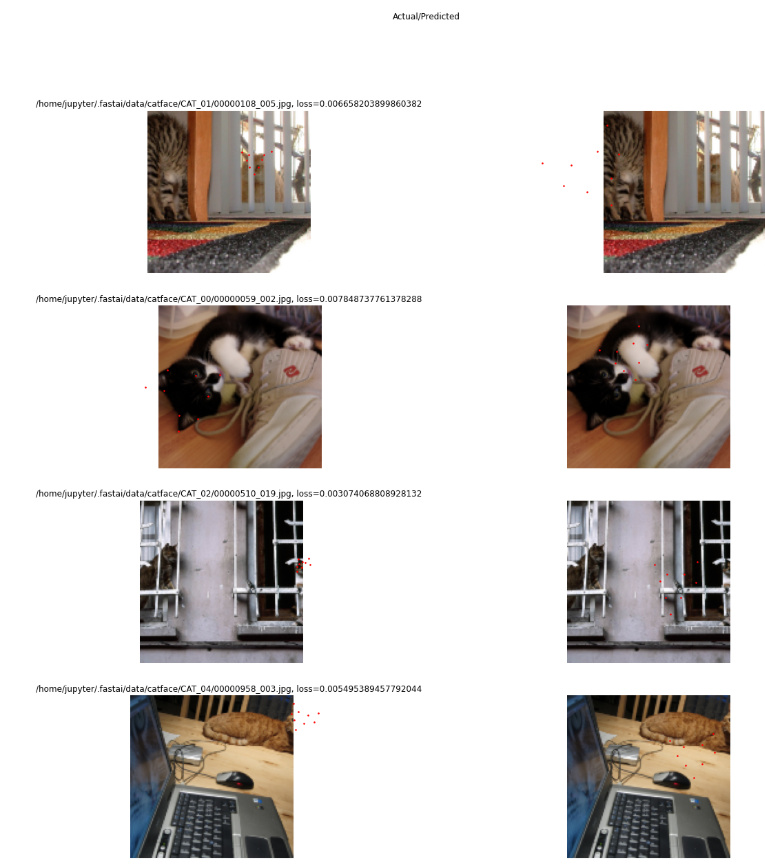
I see 4 failure modes here:
- sometimes the cat’s face is partially obscured
- sometimes my cropping was too aggressive and the cat’s face is missing from the photo and the points to predict lie outside the frame (I had applied the cropping transform with
remove_out = False, ideally I would have the transform set any points outside the image tonull) - sometimes it seems the network has not learned non-vertical cat face orientations, probably a combination of the limited transforms applied and also the loss function not penalizing “fairly close” points that heavily
- and sometimes there are multiple cats in the picture!! this one really surprised me.
Using this function I found many examples of the 4th category, such as this image from the training set:
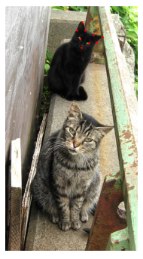
So, be careful with this dataset…
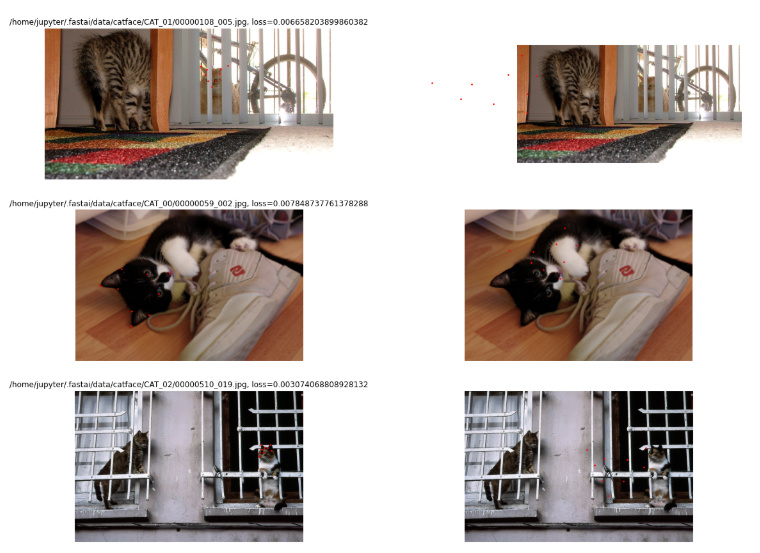
To understand the original data and where these points are coming from, I played around with having the interpretation plot untransformed images; however I couldn’t tell how to untransform the predictions so those make no sense in this case:
# Visualize worst predictions of the validation set for a PointsItemList learner
# If apply_tfms is false, will display untransformed images, not what the learner
# actually saw, which can be useful for understanding the original dataset.
def worst_preds_turn_off_tfms(learner, points_per_image=1, apply_tfms=True, limit=5, figsize=(20,20)):
    preds, y, losses = learner.get_preds(with_loss=True)
    ds = learner.data.valid_dl.dataset
    # The network output is a flat list of losses for each coord of each point,
    # so to get the loss for each image we cut the output into groups of size
    # 2*points_per_image and average
    unflat_losses = [torch.mean(losses[2*points_per_image*i:2*points_per_image*(i+1)]) for i in range(len(y))]
    # Sort from worst to best
    worst_idxs = np.argsort(unflat_losses)[::-1]

    fig,axs = plt.subplots(limit,2, figsize=figsize)
    fig.suptitle("Actual/Predicted")

    for j in range(limit):
        worst_pred = preds[worst_idxs[j]].view(-1,2)
        worst_img = ds[worst_idxs[j]][0] if apply_tfms else ds.x[worst_idxs[j]]

        # TODO get title to be over both images
        worst_img.show(ax=axs[j][0], y=(ds[worst_idxs[j]][1] if apply_tfms else ds.y[worst_idxs[j]]),
                       title=str(learner.data.valid_dl.dataset.items[worst_idxs[j]]) + ', loss=' + str(unflat_losses[j].item()))
        worst_img.show(ax=axs[j][1], y=ImagePoints(FlowField(worst_img.size, worst_pred), scale=False))
I’m aware I was working pretty low-level here as that’s where the code is easiest for me to understand, I feel like this could be written to be more generalizable to other image problems (like bounding box) by using higher-level methods like reconstruct.