@patch
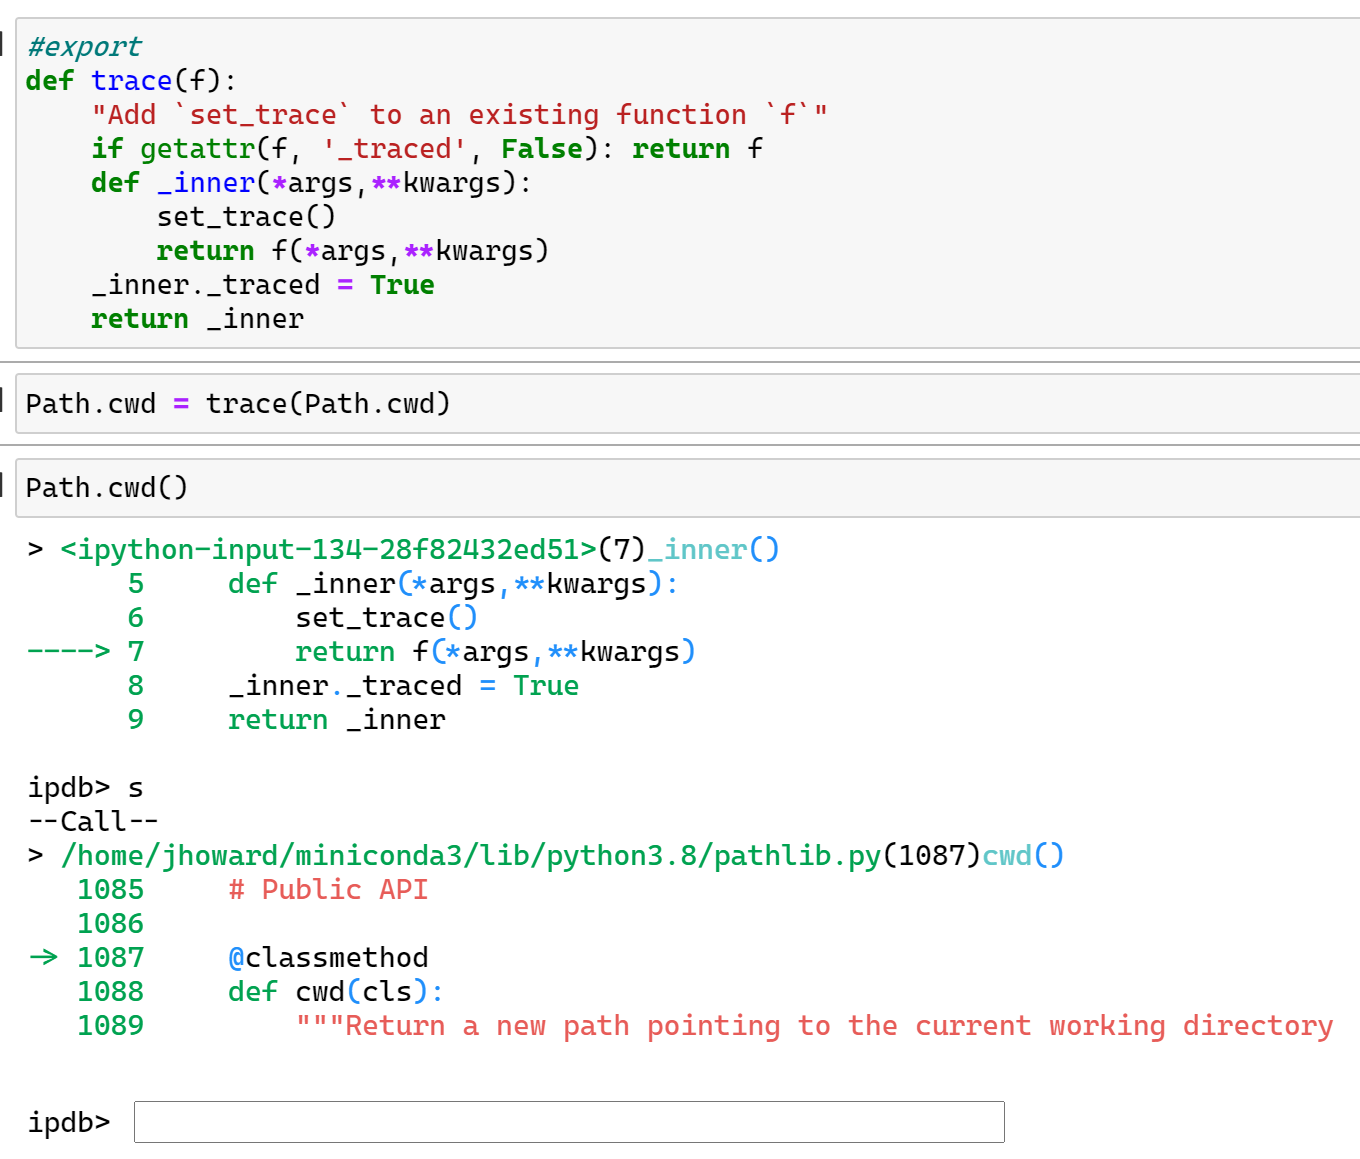
I’ve found the use of fastcores @patch quite magical for tweaking class methods. I also seem to use it alot for debugging, where I patch a method and insert pdb.set_trace() and then step through to inspect the inputs, outputs etc. However this involves copying the entire method from source code into my notebook, which can get a little messy for larger methods.
patch_debugger
Inspired by @hamelsmu and @KevinB’s dives into fastcore, I’m trying to leverage patch_to to insert pdb.set_trace() directly into the method, while staying in the notebook. I know i should be using an editor to drop this debugging code into the source code I’m trying to debug, but why not stay within the warm comfortable glow of your notebook ![]()
Debugger not quite working as expected
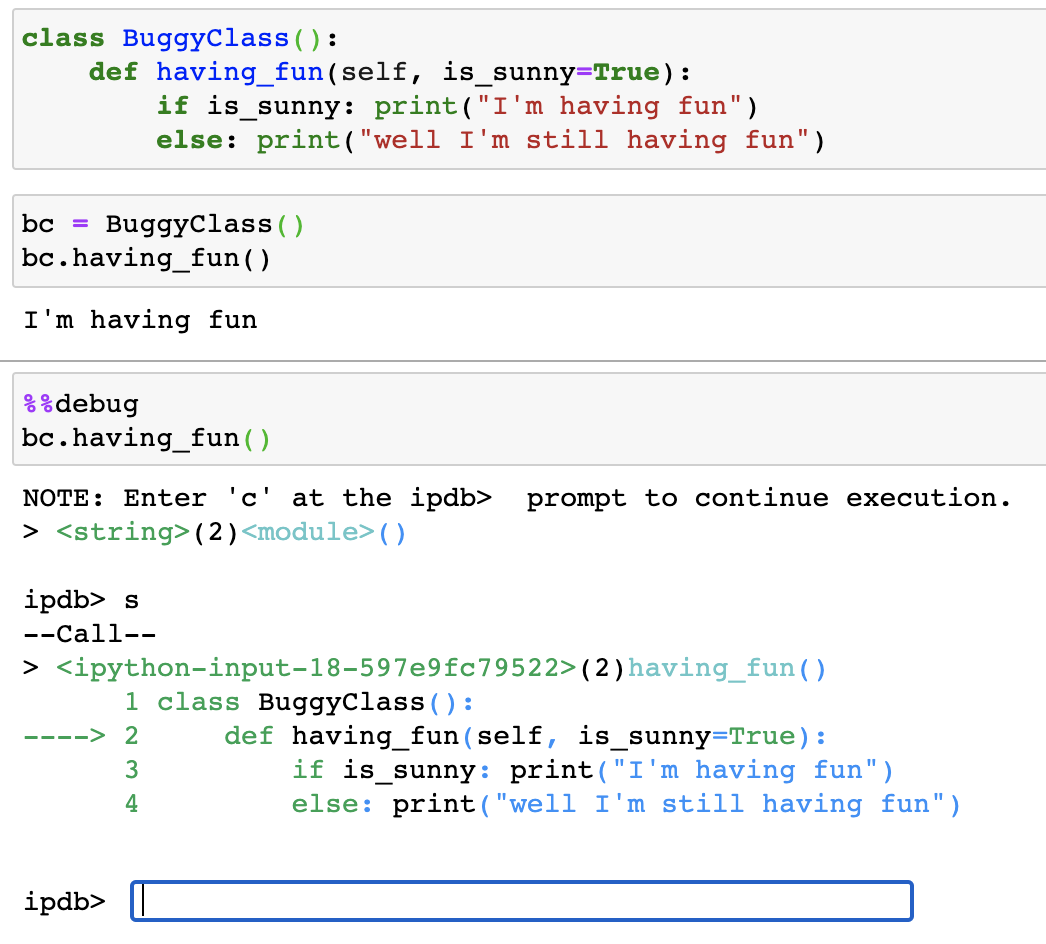
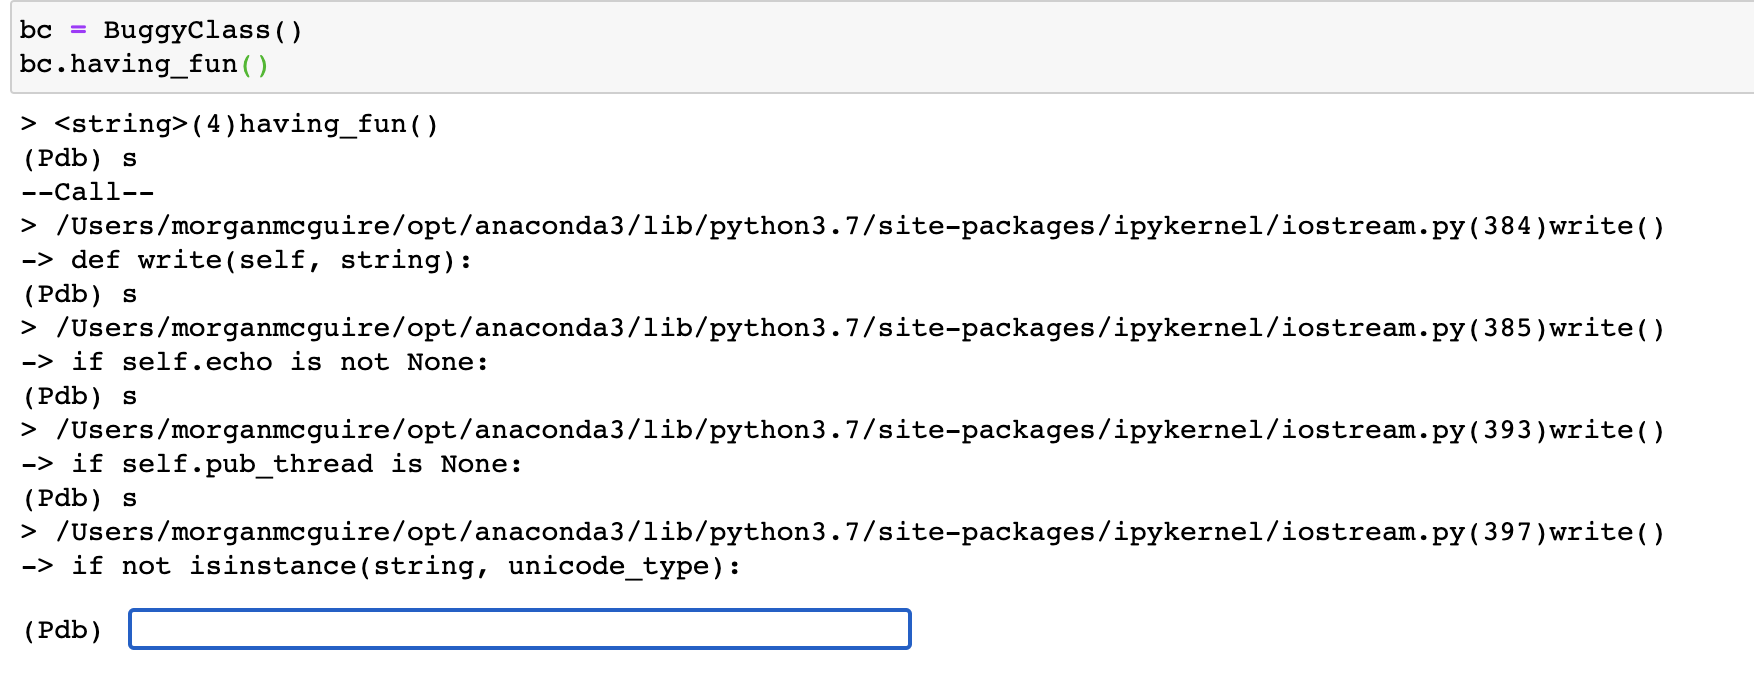
I’ve gotten a fair bit of the way there, to the point where I can insert the new code and patch it to the class. However when the class method is called and the debugger runs, it starts from a funky place in python-land (as opposed to line 2 of my function), and stepping through it brings me to strange and foreign places (and not line 3, 4, 5 etc of my function). Screenshot of a few steps in the debugger:
Help!
Any ideas where this is going wrong? I guess its to do with how I recreated the function with exec, possibly something to do with IPython…but not sure where to go from here…
patch_debugger code
import inspect
import re
from fastcore.foundation import patch_to

def patch_debugger(_cls, _f):

    # Get source code as string and split at the end of the signature
    _f_source = inspect.getsource(_f)

    # Remove any spacing 2+ spaces long
    _f_source = re.sub(r'( ){2}', '',_f_source)

    # split the function by new line
    s_func = _f_source.split('\n')

    # Add the class annotation
    s_func[0] = s_func[0].replace('self', f'self:{_cls.__name__}')

    # define the debugger lines to insert
    db = ['import pdb','pdb.set_trace()']

    # create list of new function lines
    new_func = []
    new_func.append(s_func[0])
    new_func.extend(db)
    new_func.extend(s_func[1:])

    # turn list into a single string
    nf = new_func[0] + '\n'
    for n in new_func[1:]:
        nf += '   ' + n + '\n'

    print(f'New function created: \n\n{nf}')

    # Create a new function from string new_func
    exec(f'{nf}', locals(), globals())   # globals()

    # create assign an object to our new function
    exec(f'j = {_f.__name__}', locals(), globals())

    "Decorator: add `f` to the first parameter's class (based on f's type annotations)"
    cls = next(iter(j.__annotations__.values()))
    #return patch_to(cls)(j)
    patch_to(cls)(j)
Our class to debug
class BuggyClass():
    def having_fun(self, is_sunny=True):
        if is_sunny: print("I'm having fun")
        else: print("well I'm still having fun")
Test everything is working
bc = BuggyClass()
bc.having_fun()
I’m having fun
Patch our debugger code into BuggyClass.having_fun
patch_debugger(BuggyClass, BuggyClass.having_fun)
Run the patched method
bc = BuggyClass()
bc.having_fun()
Debugger starts here