Hi!
I was in need of plotting only the lasts X epochs of a training of Y epochs, since in the very firsts epochs the difference between training and validation loss was very big, and impeached me to control the overfit in the very last, which of course are the most important.
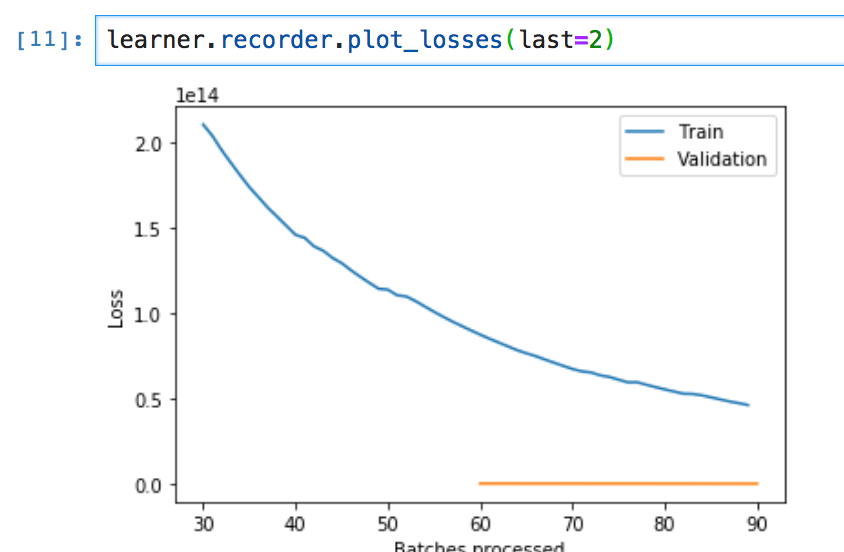
So I implemented in the plot_losses() function the capability of accept an integer as parameters with the number of epochs you want to actually plot.
In the following pictures you see the usecase on a mock training: the full plot in the first (3 epochs), and the plot with only the last 2 epochs losses.
And I also added labels.
Do you like it? If yes, I proceed with the PR. More: do you think it deserves a test? I mean, it’s so simple…
cheers!