What is kind of confusing is that if you look at it’s constructor, it takes a tokenizer … which is a class that does the actual work of tokenizing your inputs, and has a interface you need to implement should you make you’re own. In fastai parlance, it is referred to as the “tokenization function”.
If you look at the SpacyTokenizer and SentencePieceTokenizer classes, you can get an idea of how that interface is to be implemented. The minimal implementation requirements are here.
Sorry for the confusion … by that I meant that a custom Tokenizer needs to implement the functions you see in BaseTokenizer.
And again remember, that is this the “tokenization function” … that is used by the Tokenizer transform. As I said, the nomenclature is a bit confusing.
if lr = 1e-3 -> [0.001,0.001,0.001]
if lr = slice(1e-3) -> [0.0001,0.0001,0.001]
if lr = slice(1e-5,1e-3) -> array([1.e-05, 1.e-04, 1.e-03])
instead of lr/3 should be lr/10
i think a better way to put it is - train first param group with 1e-6 , last param group with 1e-4 and the middle param group/s are evenly geometrically spaced between 1e-6 and 1e-4.
usually we divide then param groups into 3 groups.
In general, Jeremy made some experiments with this to find what worked best on Rossmann. What he found was a general rule dictated in the code:
def emb_sz_rule(n_cat):
    "Rule of thumb to pick embedding size corresponding to `n_cat`"
    return min(600, round(1.6 * n_cat**0.56))
So as you can see it’s 1.6 * the cardinality of the variable to the 0.56. Some people have had success making it just a little bit higher than what’s given, but this rule works very well. If this looks a little different from in the past this is because it was actually changed and updated
cardinality would work for columns with categorical data right? how would you use this for setting emb_sz in collaborative filtering - for latent factors ? @muellerzr
You should create a file in /root/.kaggle/ named kaggle.json … that looks like this:
{"username":"your username", "key":"you api key"}
Jeremy’s notebooks have some code to create this for you (if I recall from the last lecture), but you may have to change it to save to the correct place in paperspace.
My guess, without seeing everything, is that when you call predict, what you are giving it is not an image object (and in particular, I think it has to be a fastai2.vision.core.PILImage object).
Dear @wgpubs, sorry if I missed yesterday,
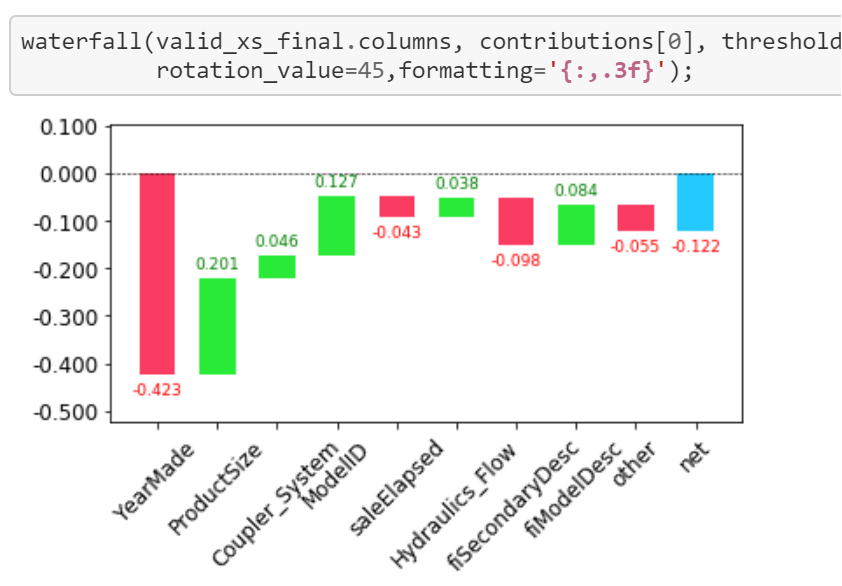
I was wondering about this chart, it the green bars the one that influence most our predictions?
or we should just looking at the lenght of the bars?
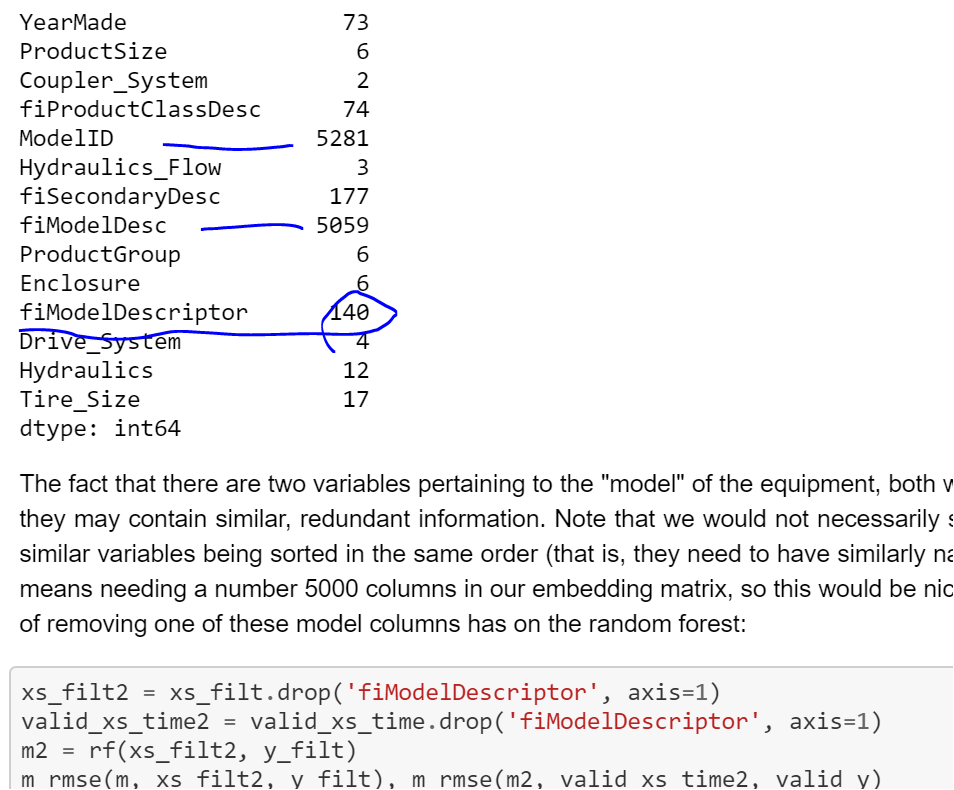
Also this part doesn’t make sense to me, he is talking about ModelID and fiModelDesc to have an high number…
so why he decided to remove fiModelDescriptor.
I am a bit confused
I think it may be a typo … that what they meant to do is drop fiModelDesc because, based on the numbers, it seems like it may have a strong correlation with ModelID.
Could you link to this post from the official lecture thread? Would be nice if either Jeremy or Sylvain can confirm things either way.
As I understand things, what this shows is for a given row (so for a specific record), how we got to the final prediction we did for it (e.g., the column labeled “net”) from the mean value of our target/dependent variable (the prediction before any splits).
So in the example, that mean value is 10.10 (that is where we start) … and the prediction for this record is 9.98 (where we end up). “YearMade” had a negative effect on the price … dropping it by .423, whereas “ProductSize” had a positive effect … raising it by .201 over that mean. The waterfall plot shows what effect each of our independent variables played in getting us to that 9.98 prediction.