I’m trying to write my own recreation of the collaborative filtering notebook’s crosstab, but there is no example code in that notebook (it’s an image of Excel, I think?). Shown in the Chapter 8 of Fastbook, and in the Lesson 7 video.
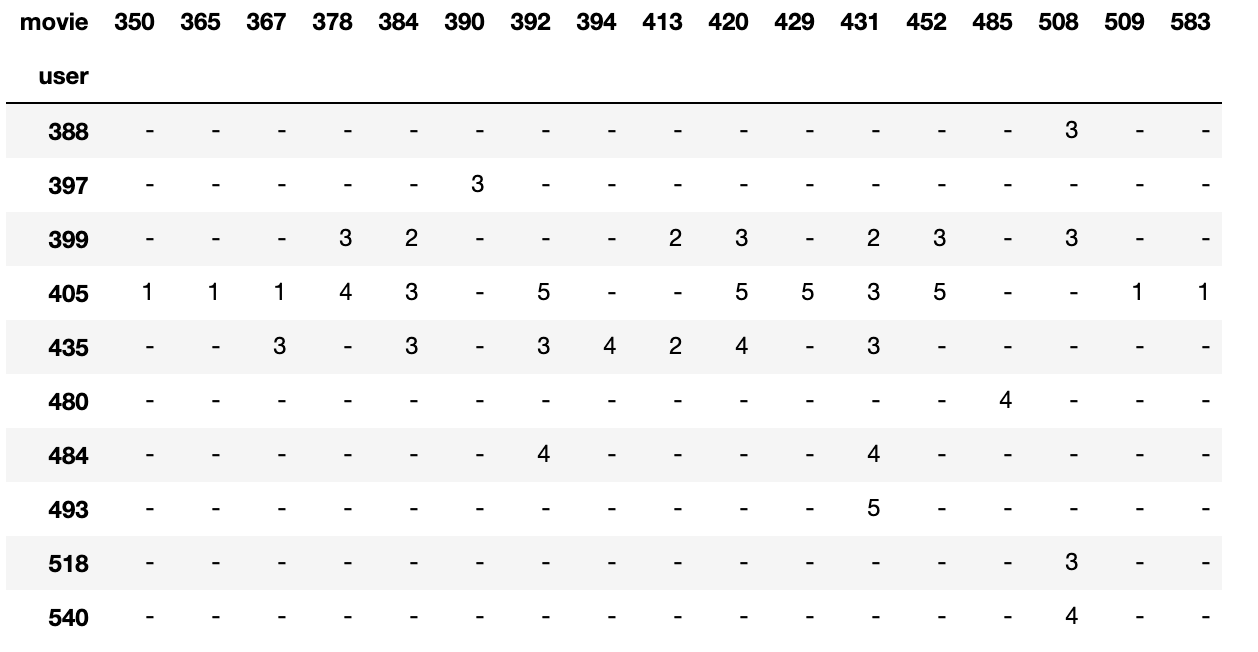
I tried to recreate it, but this is as far as I got. While it’s better than a random crosstab, it’s still much more sparse than what the author used. The idea is to improve on a complete but sparse crosstab of everything by first filtering and then joining the most frequent raters with the most frequently rated movies. I thought this would be more dense, but it’s only halfway there.
(setup if you want to copy/paste)
from fastai2.collab import *
from fastai2.tabular.all import *
path = untar_data(URLs.ML_100k)
ratings = pd.read_csv(path/'u.data', delimiter='\t', header=None,
                      names=['user','movie','rating','timestamp'])
(my crosstab attempt)
most_frequent_users = list(ratings.user.value_counts()[:20])
most_rated_movies = list(ratings.movie.value_counts()[:20])
denser_ratings = ratings[ratings.user.isin(most_frequent_users)]
denser_movies = ratings[ratings.movie.isin(most_rated_movies)]
pd.crosstab(denser_ratings.user, denser_movies.movie, values=ratings.rating, aggfunc='mean').fillna('-')
Any fluent pandas users know how to slice the frame to have a dense crosstab more like the first image?
1 Like
I posted this on my TWIML study group today https://twimlai.slack.com/archives/C01ALNFJBR6
Take a look at the “Slack Meeting chat Notes”, I posted yesterday (10/20/2020) and look at the reply. I posted a long thread on how I got to these videos and spreadsheets, which I think will help you.
You can also join our group and ask us questions, although we’re in lesson video #8
Enjoy!
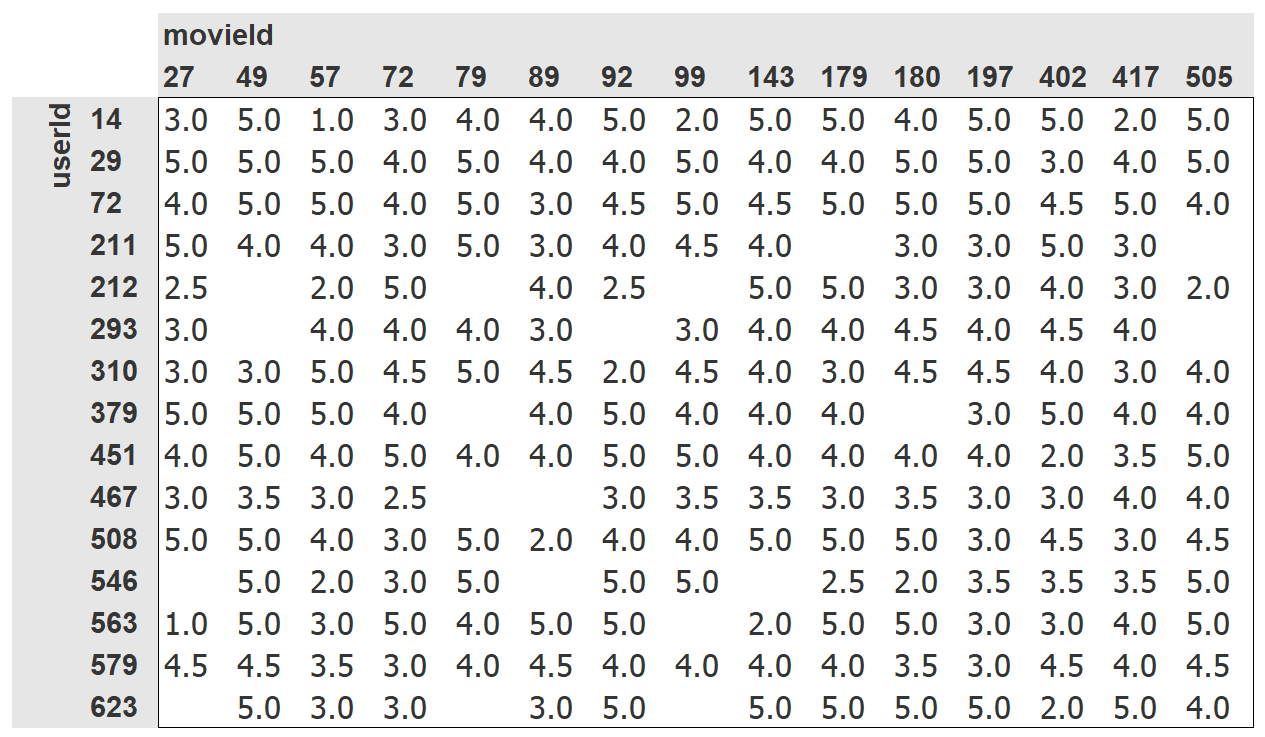
I posted a StackOverflow question, then eventually figured out how to do what I wanted and posted the answer. https://stackoverflow.com/questions/64344352/pandas-dense-crosstab-with-n-most-frequent-from-column1-and-column2?noredirect=1#comment113780423_64344352
Basically, there was an error in my most_frequent_* sampling (I was using the value counts instead of the top values’ ids), and there’s also a smarter way to grab the most frequent ratings of the most frequent users. Final code below.
n_users = 10
n_movies = 20

# list the ids of the most frequent users (those who rated the most movies)
most_frequent_users = list(ratings.user.value_counts().index[:n_users])
# grab all the ratings made by these most frequent users
denser_users = ratings[ratings.user.isin(most_frequent_users)]

# list the ids of the most frequent movies within this group of users
dense_users_most_rated = list(denser_ratings.movie.value_counts().index[:n_movies])
# grab all the most frequent movies rated by the most frequent users
denser_movies = ratings[ratings.movie.isin(dense_users_most_rated)]

# plot the crosstab
pd.crosstab(denser_users.user, denser_movies.movie, values=ratings.rating, aggfunc='mean').fillna('-')
And the result
1 Like