@bluesky314
Above code is to normalize the images (btw this is not how you want to normalize the images) then np.tile to create 3 channels by copying 1 channel 3 times!
@wyquek@bluesky314 I have removed normalization from the data!
I have tried Fashion MNIST on the same custom DataSet. I am getting same issue. So now we know, there is a problem somewhere in the Custom DataSet class. But what could be the issue? Maybe @lesscomfortable can help?
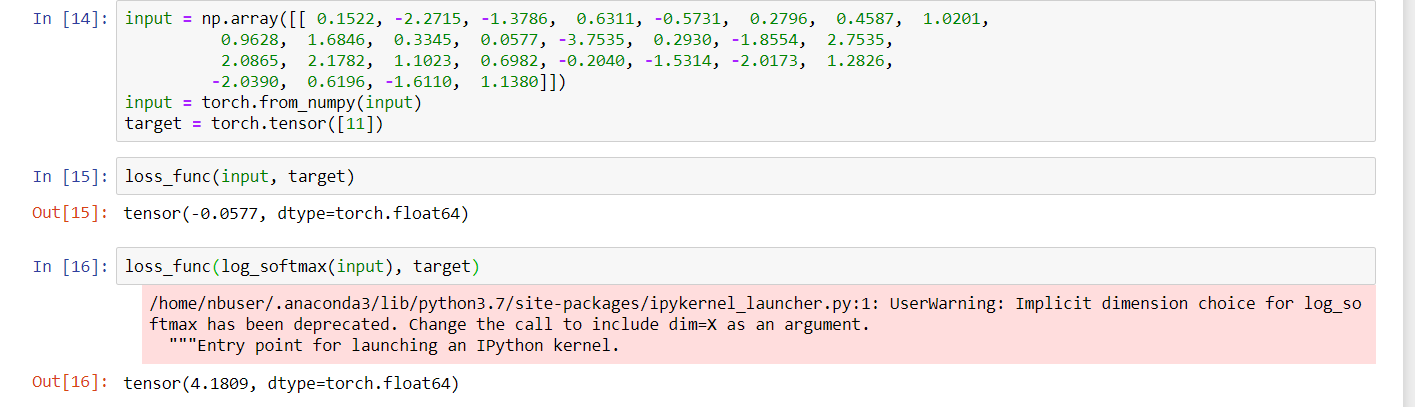
By the way as par this notebook which I created to understand the torch.nll_loss, I am also receiving the negative values (outputs) of the loss function. I have attached a screenshot in this forum doubt which went under the bag.
The input in this screenshot is obtained by running the Arabic MNIST notebook with 1 batch size, debugging and inspecting the output of the model with %%debug.
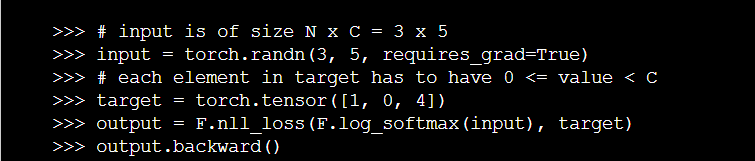
just guessing but for your latest example would you like to try using F.nll_loss(F.log_softmax(input), target) from example in pytorch docs
# input is of size N x C = 3 x 5
input = torch.randn(3, 5, requires_grad=True)
 # each element in target has to have 0 <= value < C
target = torch.tensor([1, 0, 4])
output = F.nll_loss(F.log_softmax(input), target)
output.backward()
not quite sure, but seems like you could be missing a softmax somewhere.
Right that is exactly what I was thinking but again why I would be missing the softmax because I called DataBunch.create and model is still created by create_cnn. Also DataBunch is creating dataloaders. Shouldn’t DataBunch or create_cnn apply softmax? This is why I am cancelling the possibility of softmax. (Or am I missing something?)
Also I noticed that PyTorch official docs says, we need to apply log_softmax with F.nll_loss and I couldn’t find any occurrence in the code related to log_softmax. Also hidden function _loss_func2activ which is using proper activation function for loss_function is used only at the time of prediction and not at the time of calculating loss (in get_preds only).
Either I am missing something big or there is bug (which I highly doubt is the case because I am the only one who received negative loss)
I suppose you could do that too, but I can’t help but noticed @uwaisiqbal, a fastai student, had hit the ball out of the ballpark 10 days ago on Kaggle using fastai v1 codes sort of similar to the lesson notebook
Now when we created the custom dataset with DataBunch.create method, this label function was not called and hence Fastai library added default loss function which is F.nll_loss.
@wyquek (and me) already have discussed how F.nll_loss(F.log_softmax(inp), out) == F.cross_entropy(inp, out) Which is F.cross_entropy applying F.log_softmax automatically but in case of F.nll_loss we need to apply that manually. And when you don’t apply F.log_softmaxresult can be negative. So it is a good idea to give a look at your loss function and pondering whether you are getting desired loss function or not!
(Now it would be really great if someone from fastai can confirm my findings! )
Two solutions for this:
Apply F.log_softmax on inputs before feeding them to F.nll_loss
An easy solution is set loss function manually. learn.loss_func = F.cross_entropy
Excellent analysis. To add to this answer, I would first print out the predictions that are made. Then would plot the histogram for both predictions as well as ground truth. And would come up with calculating loss for some values using different loss functions for values which are causing negative frequency in histogram. But still your approch sounds easy and apt one.
Just saw this thread today. I put together a solution with the Arabic MNIST dataset here.
The github repo is a fork from the original repo with the dataset where he has the images saved as files as well.
Rather than using the raw data from the csv I used the image files and created a directory structure to match what is needed by the fastai library. My best guess is that something has gone wrong when you are converting the csv values to pixel values for the fastai library to then use.
Good spot! I’ll update it when I get some time. Haha I spent a couple hours at it and tried a bunch of things but that 96.8% is pretty stubborn. If you take a look at the most confused items, they are really poorly handwritten examples which look like scribbles lol. I think it’s because of the data.