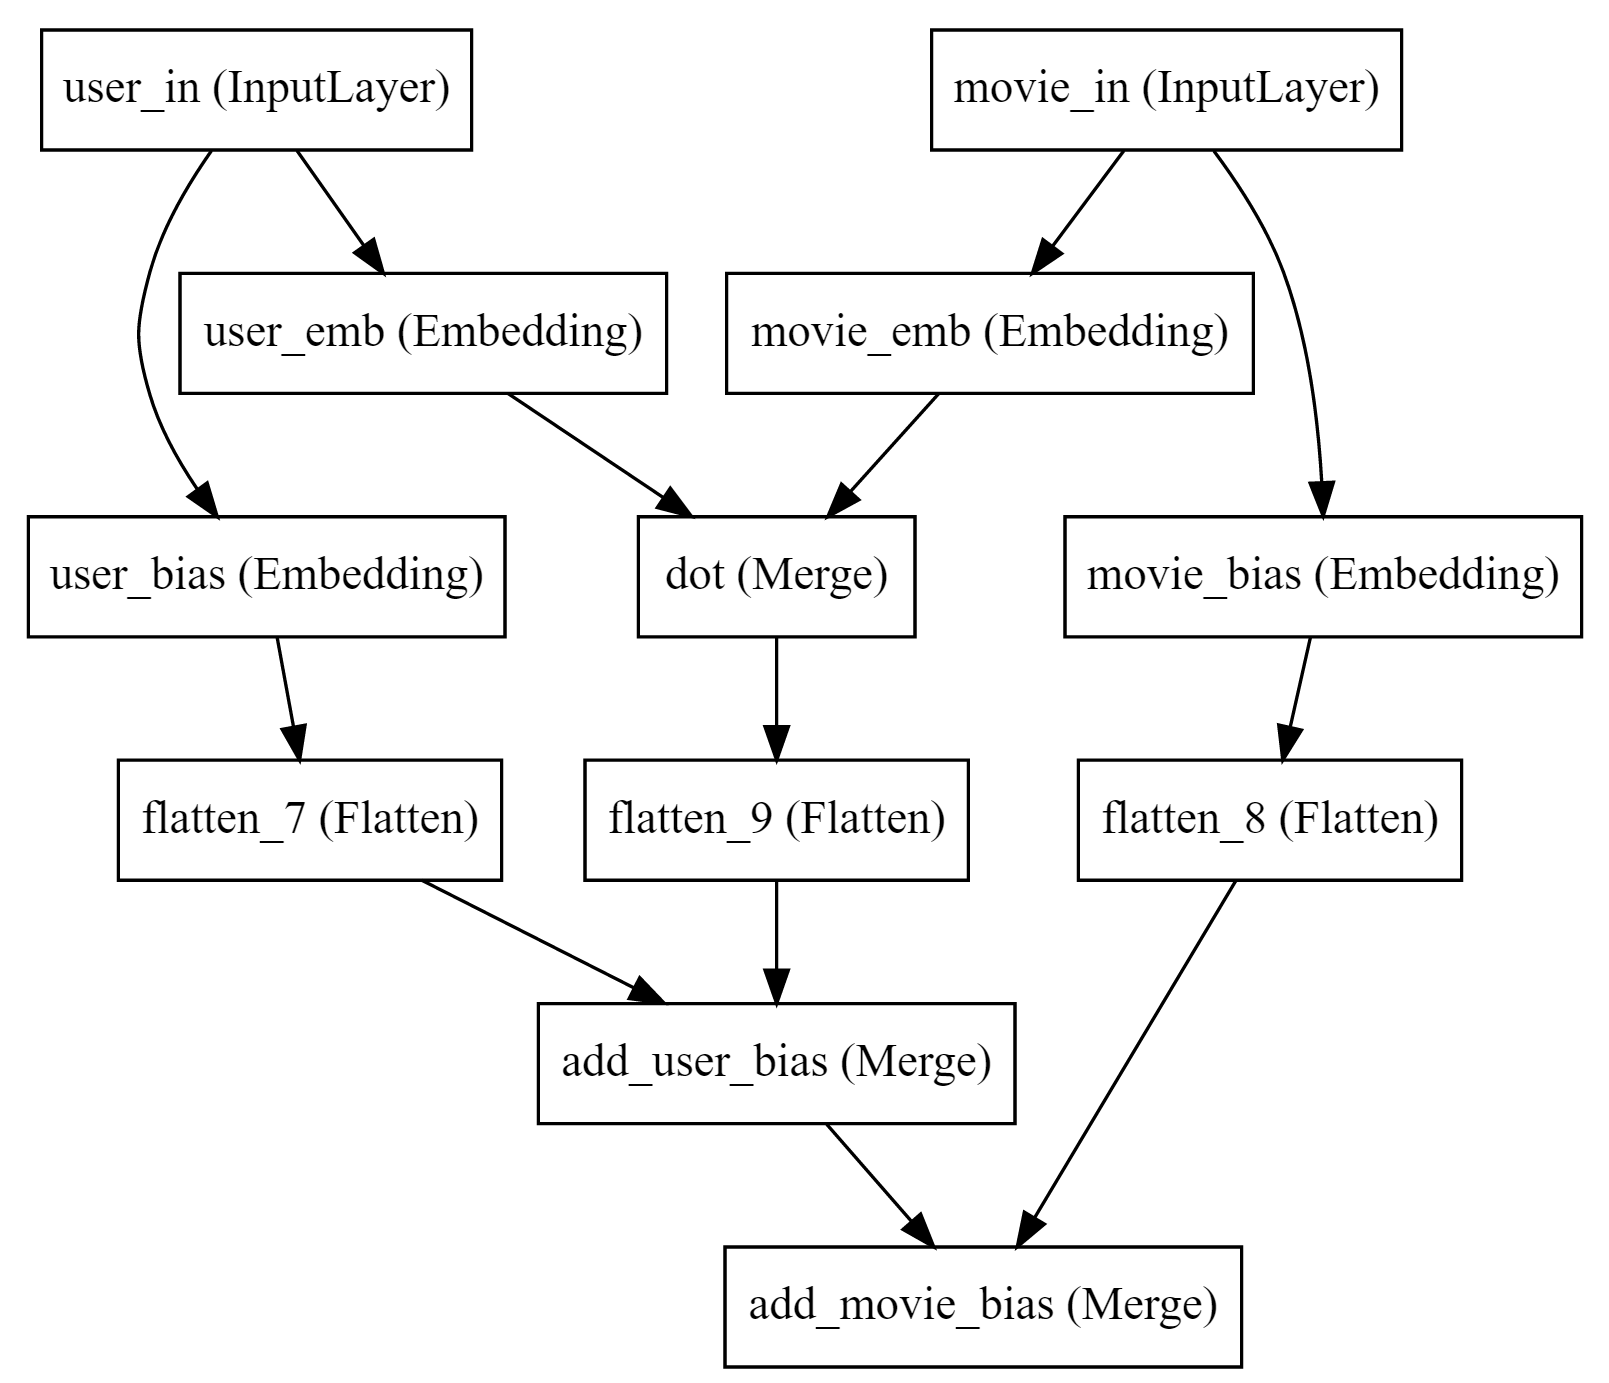
I figured I’d create a new thread to talk about ways people have found to visualize models, training, and results. I’ll start with a tip - you can visualize your model as follows (you’ll need to conda install pydot, and apt install graphviz):
from IPython.display import SVG
from keras.utils.visualize_util import model_to_dot
SVG(model_to_dot(model).create(prog='dot', format='svg'))
Here’s the definition of the movielens ‘bias’ model:
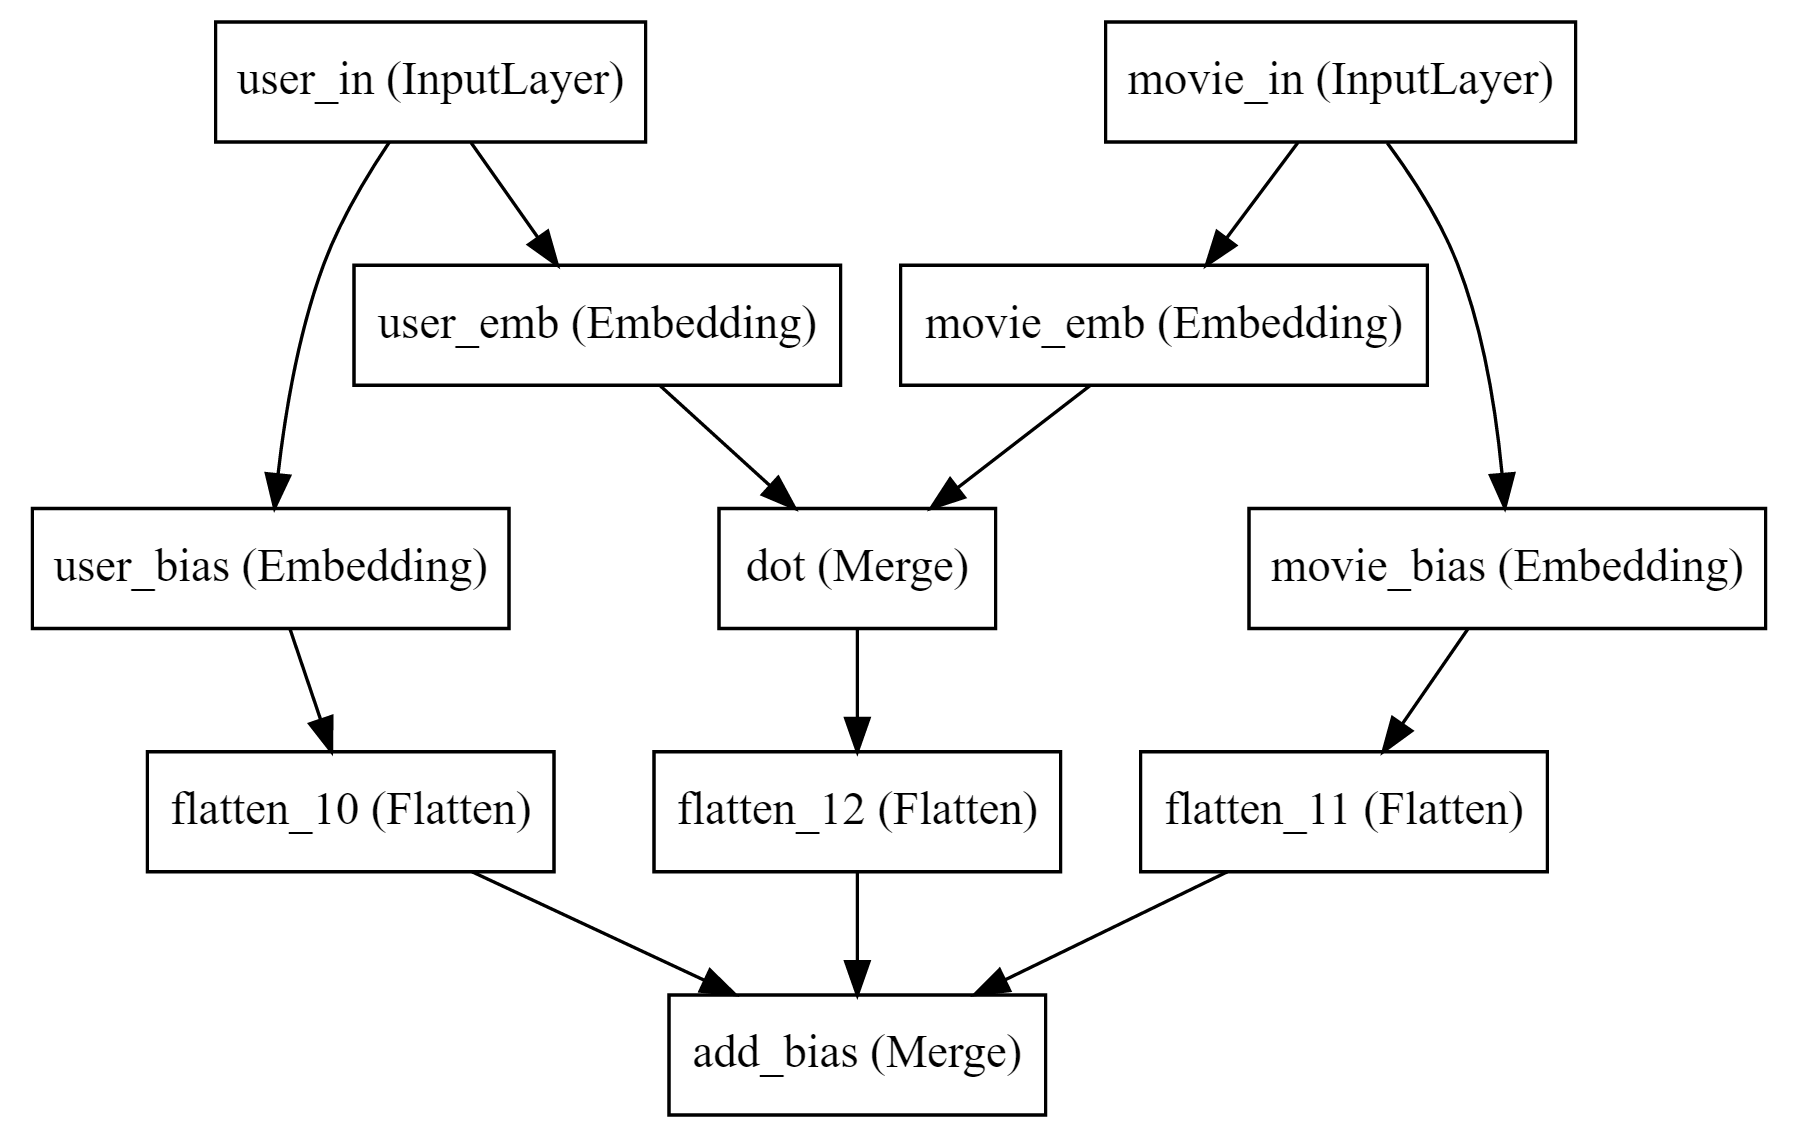
Heh - that picture has already helped! Looking at it, it’s clear that the last layer would be more elegantly expressed as a sum of both bias layers at the same time. Here’s the revised model - as you can see the symmetry of the user and movie parts is even more clear now: