It’s mentioned in the book that white pixels are 0s and black pixels are 255s, and so is the result of numpy array, tensors, dataframe,etc. But when we just display the image using PIL/default photos app, it shows it as a negative image (with black background and white digit).
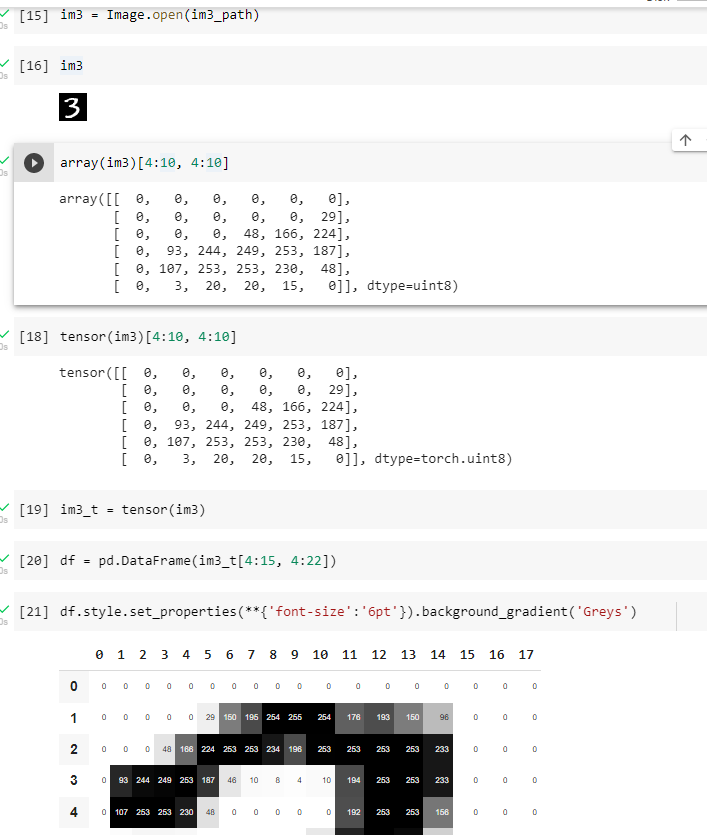
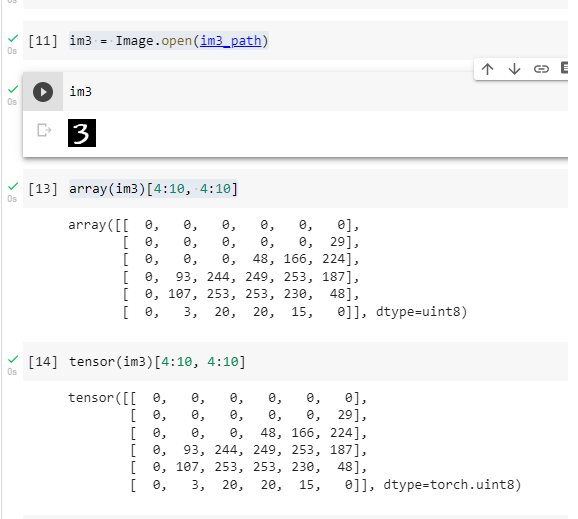
Here you can see the execution of im3 gives an image with black background, and the execution of the dataframe statement gives an image with a white background.
This is a bit confusing to me. Would appreciate an explanation.
When MNIST was published, 0 and 255 were intended to represent white and black respectively, that is, black foreground and white background. However, most imaging packages like PIL assume 0 to be black and 255 to be white, hence the disparity you are observing.
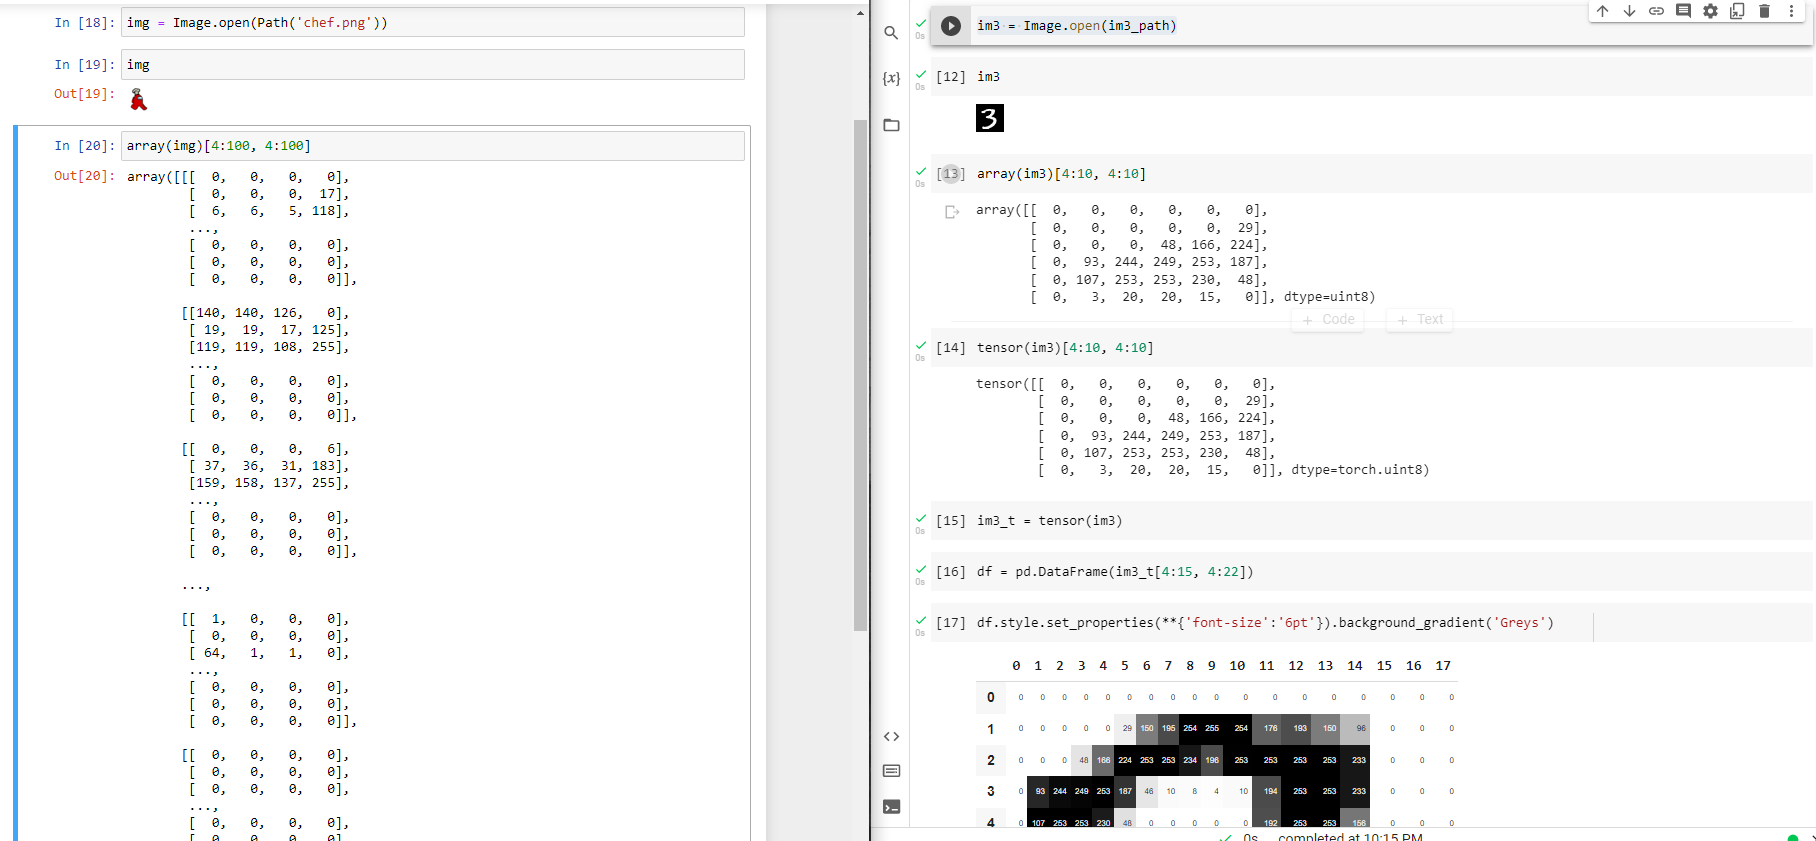
Are greyscale images treated differently than colored ones by PIL? I tried inspecting a few PNGs and I think each pixel has RGB values (x, y, z) where x, y and z range from 0 to 255. Where blacks are (0,0,0) and whites are (255, 255, 255). So I assume what my photos app and PIL are showing is indeed the correct representation for humans to consume. But I didn’t get why converting the image to a numpy array makes it the reverse and how three values (x, y, z) became a single value. Is it taking the average of R G and B as gray shades will always have all three the same?
Again, when MNIST was published, the digits were meant to be in black, but the convention followed by PIL is the reverse, so the results are not true to the original MNIST.
Grayscale uses a single value per pixel indicating brightness, but coloured images generally use 3 values per pixel for red, green, and blue (RGB).
In grayscale, black is 0 and white is 255. In RGB, black is again 0 and absolute red, green, and blue are 255. For instance, (255, 0, 0) is pure red because the value for red is 255, but blue and green are 0. As another example, (10, 100, 210) is a little bit of red, a decent amount of green, and quite a bit of blue.
Is the PNG file aware that it’s a grayscale? My assumption is that it’s a dumb data-structure that has a dimension and carries three values(R, G, B) for each of its pixels.
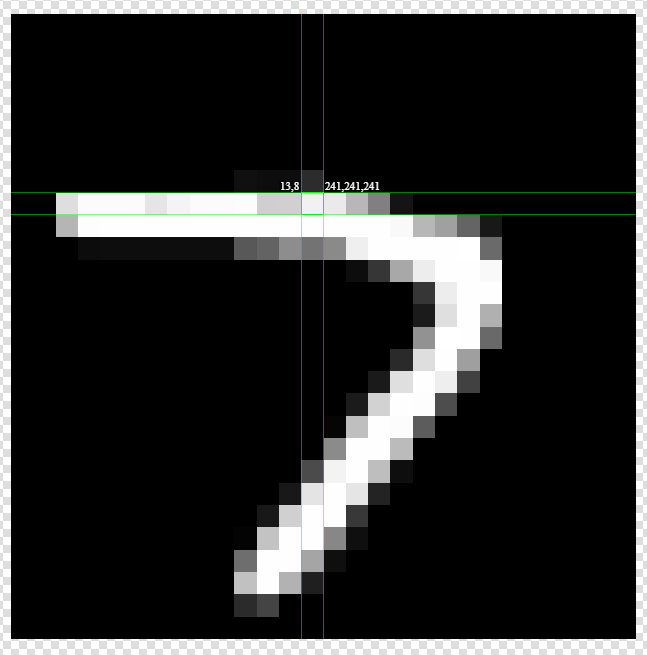
Your comment about focusing on the dimension of the two arrays also got me wondering why only rows and columns 4 onwards were chosen (i.g. ignoring the first three rows and columns). After looking at the entire image I assume it’s because the first three rows and columns are a deliberate border, but would appreciate somebody confirming my assumption.
In greyscale image. 0 is black and 255 is white.
And if you display it as an image, you will see that.
However, here those pixel values are being displayed as a styled dataframe grid,using the “Greys” colormap to style the display of the data via background_gradient().
“Greys” runs from white to black. Which in this case is more suitable for the printed page of the book.
for example, I believe switching to “gray” or “gist_gray” would make the palette match to the grayscale image. ie running from black to white