I recently stumbled across what looks to be a pretty handy feature to find the steepest section on the learning rate finder plot.
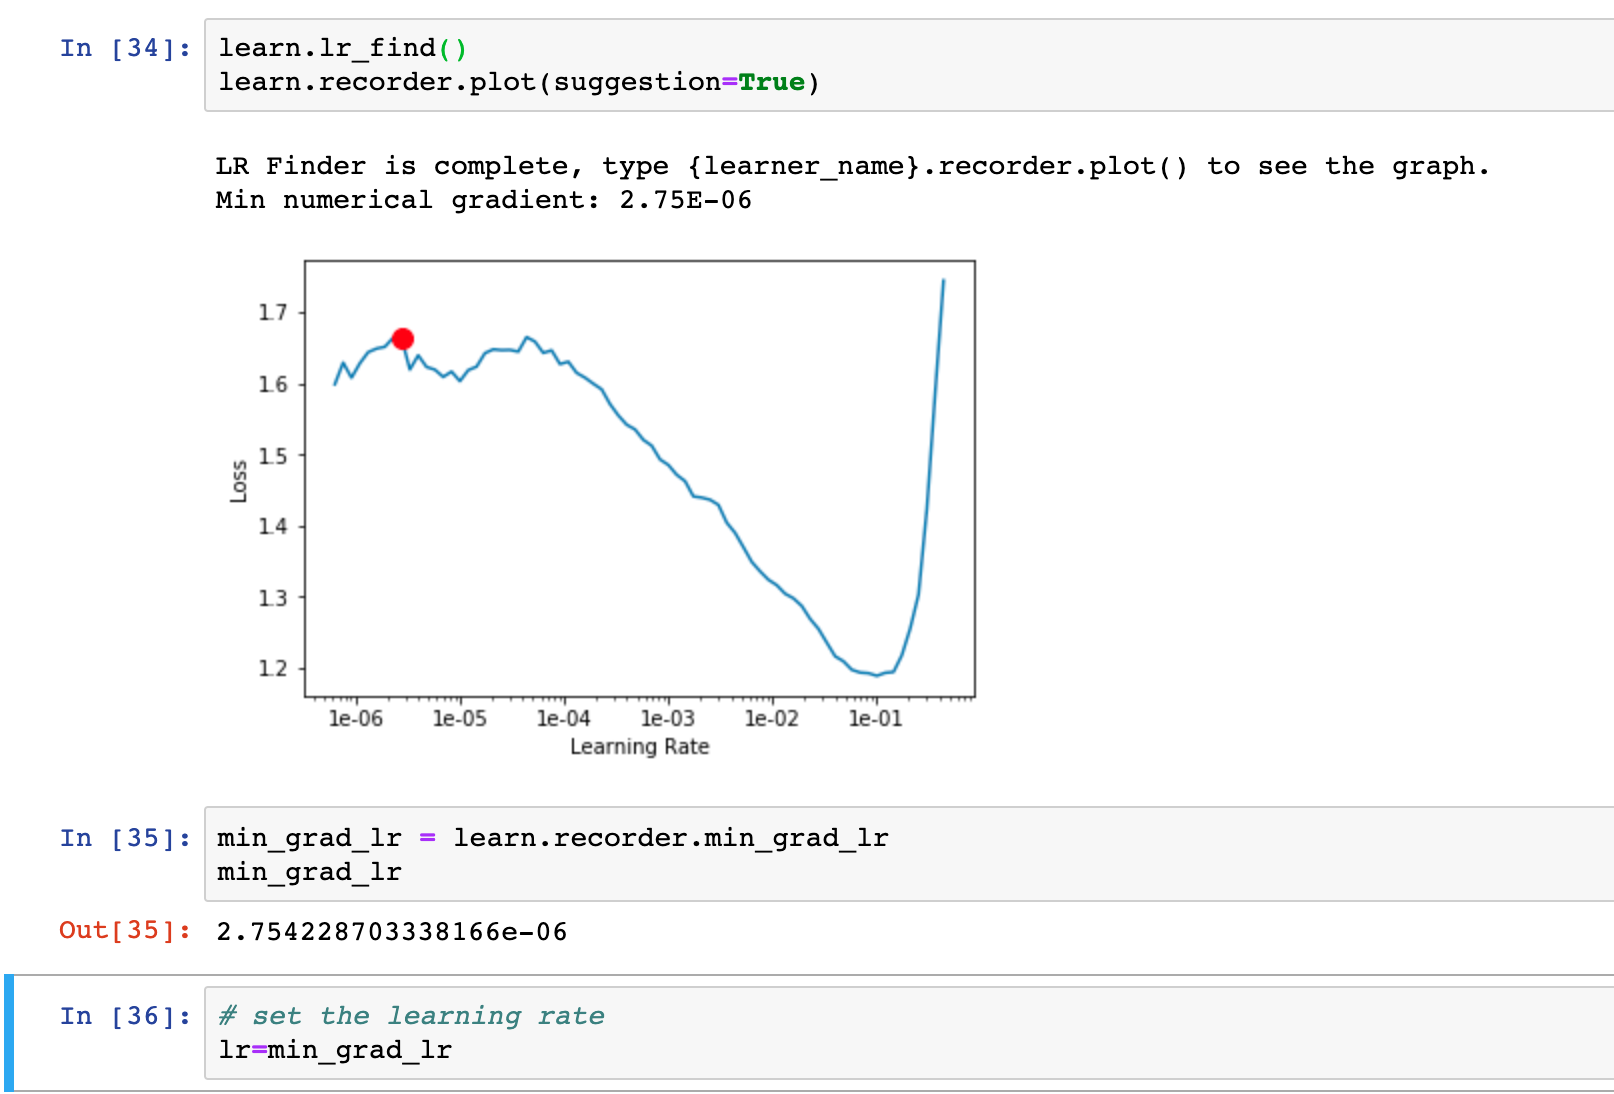
using the suggestion=True flag, the lr finder indicates the minimum gradient on the plot and suggests that to use as your learning rate.
In the plot below, without using min_grad_lr from the lr recorder, I would normally have chosen a higher learning rate value (say with this plot, around 1e-2 or 1e-2/2) than the one being suggested by min_grad_lr
Is my intuition incorrect? Or should I be choosing a learning rate according to min_grad_lr?
I also would have chosen closer to 1e-3 or 1e-2, based on the videos. I suppose the danger of this suggested rate is that it’s not in an area of clear and consistent downward slope?
Either way, the proof is in the results. Did you try both your intuition and the suggestion? Now that I know this is here I’ll give it a shot in one of my notebooks and report back also.
Thanks @phren0logy yes I actually just did a few test runs and for this particular lr plot and it looks like that the min_grad_lr suggestion was significantly worse. It did feel like it was suggesting too low a learning rate to start with. I wonder when might be a good time to use that particular suggestion.
I guess if the suggestion fell somewhere between the range where you would be visually choosing between two lr’s (ie like 1e-3 and 1e-2), it could be a useful in that scenario maybe to find the optimal point between the two.
On my test runs I found the exact same thing you did. What I also found is that if I don’t freeze the random number generator, that learning rate plot can vary quite a bit (at least with my data). So it still feels a bit like black magic.