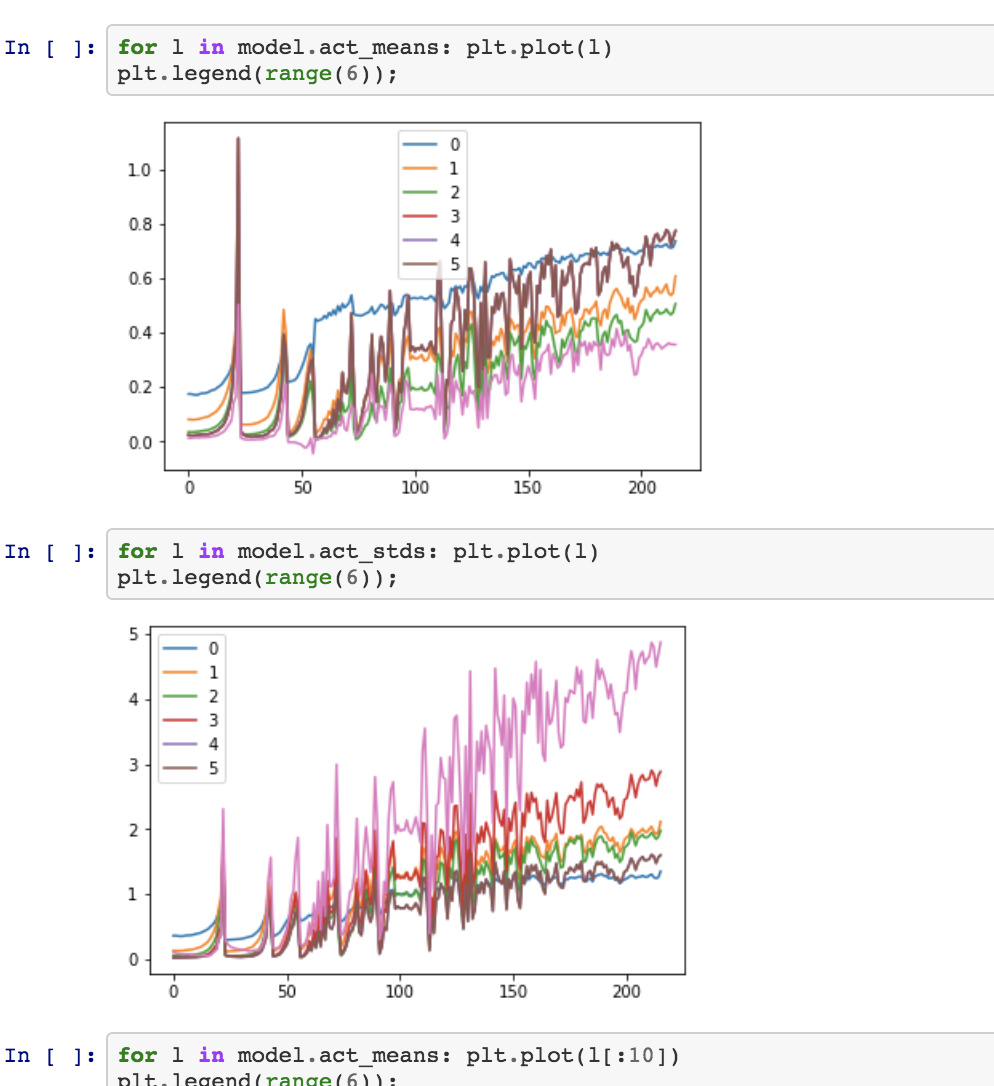
A big part of lesson 10 was the running means and stds of the outputs of each layer. They can be seen in the following notebook to be very erratic for 2 epochs:https://github.com/fastai/course-v3/tree/master/nbs/dl2 as:
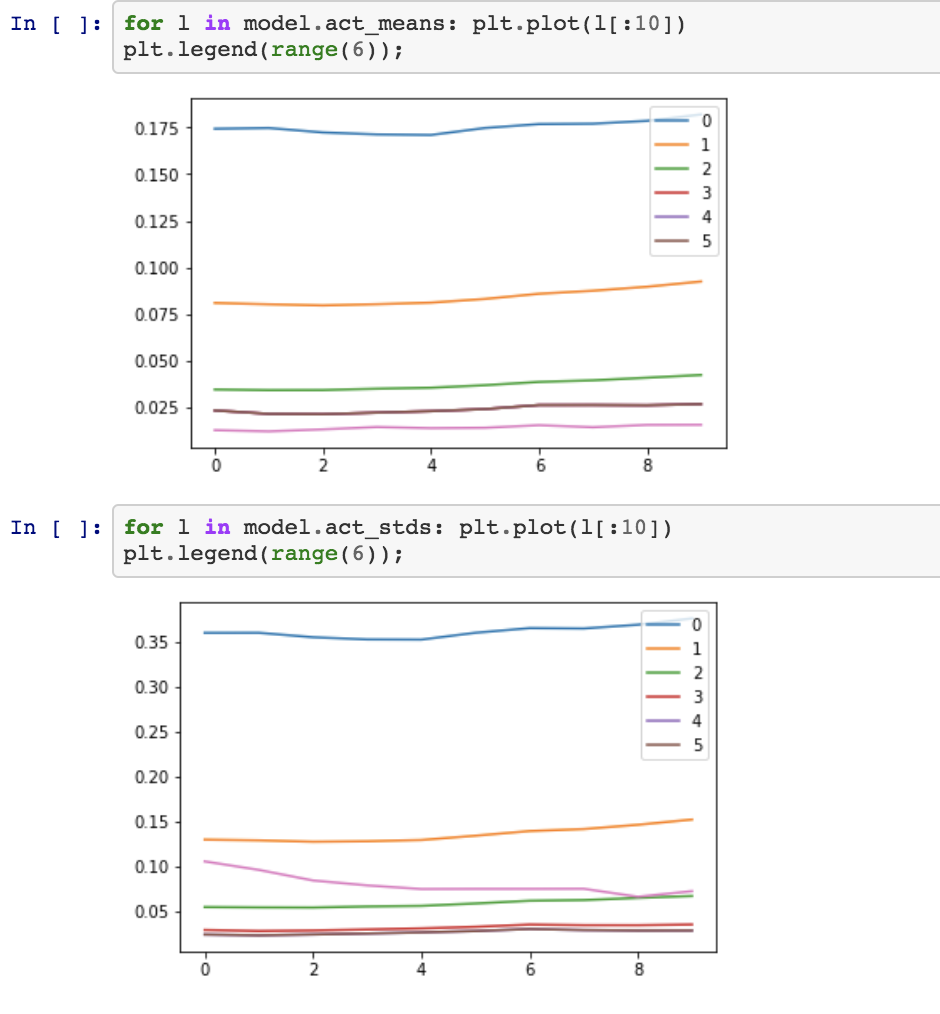
Then we saw that if we just saw for the first 10 batches they were flat:
Then we tried our version or ReLu and batchnorm to show how these can be made stable, however when I trained a model on fashion MNIST I got pretty flat statistics right from the start for 12 epochs. I ran the same model and got:

I dont understand why I’m not getting the different curves as Jearmy did