Getting a sense of LR finder plots might be useful for detecting bugs, and for detecting the novelty of a dataset, architecture, or hyperparameter value. We can do that by looking at a bunch of them in their contexts.
If you right click a figure in a notebook and press “Copy Image”, you can paste it into a reply here (on Google Chrome at least).
dataset: Camera Model Identification
arch: resnet50
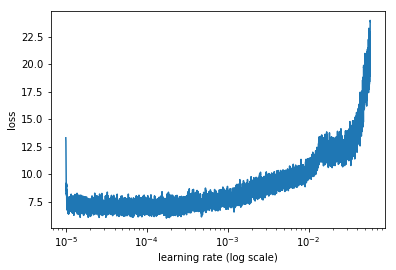
Before training the FC layers:
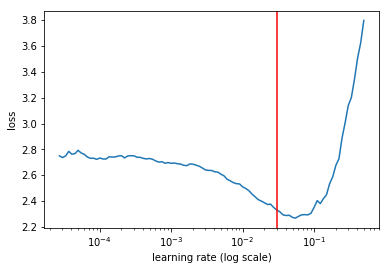
After training the FC layers, and unfreezing. No data aug yet:
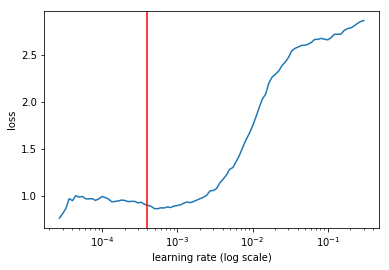
The red lines represent the learning rates I chose. Let me know if you would have chosen differently.
learn.lr_find()
learn.sched.plot()
plt.axvline(x=LR, color="red");
Inspired by Andrej Karpathy’s loss function blog.