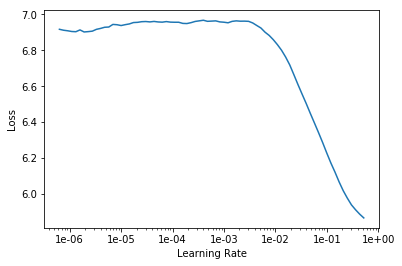
I would like to ask the friends in the forum if the following plot from the LR finder is ill defined:
As of now all the plots I have seen in the lectures have also a part that goes up at their right end. How am I supposed to interpret the fact that this plot does not have such a portion? If after all this plot is “healthy” what is a good learning rate to choose? 1e-01 maybe?
Thanks!
There are two reasons your LR finder can stop. Either your loss is exploding, either it has reached the maximal value of LR it can explore.
Usually we see the first case, that’s why it goes up at the end. Here, you are in the second case, which doesn’t mean it is wrong but I suggest you to change the end_lr value in the lr_find function to allow your finder to explore bigger values and get a plot that goes up at the end. Hope that helps
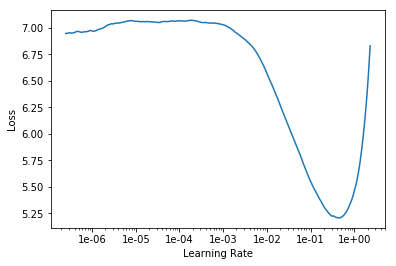
Thank you for your reply. Your suggestion led me to discover that if inside lr_find I increase num_it accordingly I receive also the right end of the plot. Here is the revised plot:
Thank you again!