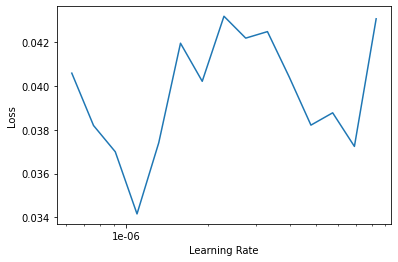
should i just use a max_lr of 1e-06? or a slice from 1e-07 to 1e-06??
i’m confused. from fresh i did fit_one_cycle(10) and it did this so i don’t understand the funky plot:
| epoch | train_loss | valid_loss | error_rate | time |
|---|---|---|---|---|
| 0 | 1.209431 | 0.400632 | 0.096774 | 00:22 |
| 1 | 0.805811 | 0.469109 | 0.225806 | 00:04 |
| 2 | 0.644564 | 0.257253 | 0.096774 | 00:05 |
| 3 | 0.558977 | 0.447386 | 0.096774 | 00:05 |
| 4 | 0.473481 | 0.529084 | 0.064516 | 00:05 |
| 5 | 0.385601 | 0.587621 | 0.064516 | 00:04 |
| 6 | 0.343027 | 0.578265 | 0.064516 | 00:05 |
| 7 | 0.306908 | 0.587580 | 0.064516 | 00:04 |
| 8 | 0.280365 | 0.594525 | 0.064516 | 00:04 |
| 9 | 0.248135 | 0.576851 | 0.064516 | 00:04 |
i’m probably doing something stupid but i can’t see what.