Hello everybody,
I am using a tabular learner for a regression problem.
Of the 51 features, I have 49 continuous variables and 2 categorical vars.
For categorical vars, one is a count, the other is a binary “Ok” and “No” column.
Mock example as follows

the databunch is as follows
data = (TabularList.from_df(train_data, cat_names=cat_names, cont_names=cont_names, procs=procs)
.split_by_rand_pct(0.2)
.label_from_df(cols = dep_var)
.add_test(test)
.databunch())
where procs = [Categorify, Normalize]. I have no missing values. The test contains 20% of a
master dataframe df.
train_data contains 80% of which I am using 20% for validation as shown in .split_by_rand_pct(0.2).
I am using a tabular learn like so
learn = tabular_learner(data, layers=[500, 100], metrics=[rmse, mae, mse])
learn.model gives the below output
TabularModel(
(embeds): ModuleList(
(0): Embedding(4, 3)
(1): Embedding(3, 3)
)
(emb_drop): Dropout(p=0.0, inplace=False)
(bn_cont): BatchNorm1d(49, eps=1e-05, momentum=0.1, affine=True, track_running_stats=True)
(layers): Sequential(
(0): Linear(in_features=55, out_features=500, bias=True)
(1): ReLU(inplace=True)
(2): BatchNorm1d(500, eps=1e-05, momentum=0.1, affine=True, track_running_stats=True)
(3): Linear(in_features=500, out_features=100, bias=True)
(4): ReLU(inplace=True)
(5): BatchNorm1d(100, eps=1e-05, momentum=0.1, affine=True, track_running_stats=True)
(6): Linear(in_features=100, out_features=1, bias=True)
)
)
Is using embeddings for such simple categorical columns overkill. What other way can I handle could I handle them, if required, I maybe totally wrong about this, so please correct me if that be the case.
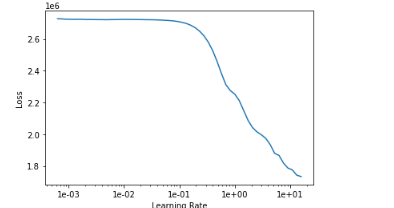
My lr range test for this seems to be wrong
learn.lr_find(start_lr=1e-04, end_lr=1e+04)
I get the following plot
I feel this is wrong because deep-learning-optzrs-sinceAdam, says the following:
FROM THE ARTICLE
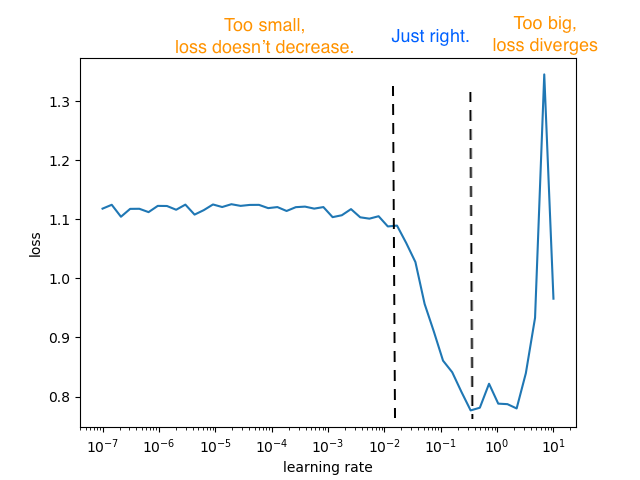
“A plot for LR Range test should consist of all 3 regions, the first is where the learning rate is too small that loss barely decreases, the “just right” region where loss converges quickly, and the last region where learning rate is too big that loss starts to diverge.”
My plot does not have the last region, where the loss increases.
Does this mean something is wrong with my model, or is my data incorrect. Training with
9e-01 = 0.9 as my maximum learnig rate and using the 1cycle policy fives me the following result,
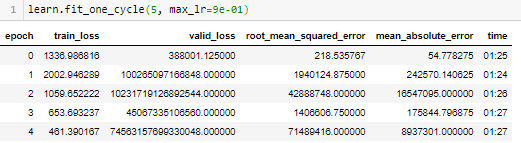
Terrifying to say the least!
I have tried with default lr in fit one cycle, fit for 35 epochs, but with layers like [200, 100, 50], [300, 200, 100, 50] and [200, 150, 50], then used wd=0.1 for a 2 or epochs.
All I can do is get the valid_loss down to as much as 24 with train loss > valid loss.
The test metric is not good. I am getting an accuracy of only 50% on the test data.
preds = learn.get_preds(ds_type=DatasetType.Test) # the 20% cut that I had done earlier.
Using my own custom metric here: abs(y_true -y_pred) <=15. Only 50% of my observations on the test satisfy this metric.
Does it need more data?
Please help, how can I improve my model. Thanks very much.