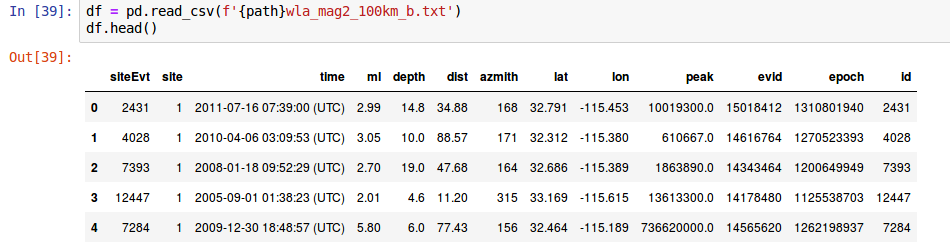
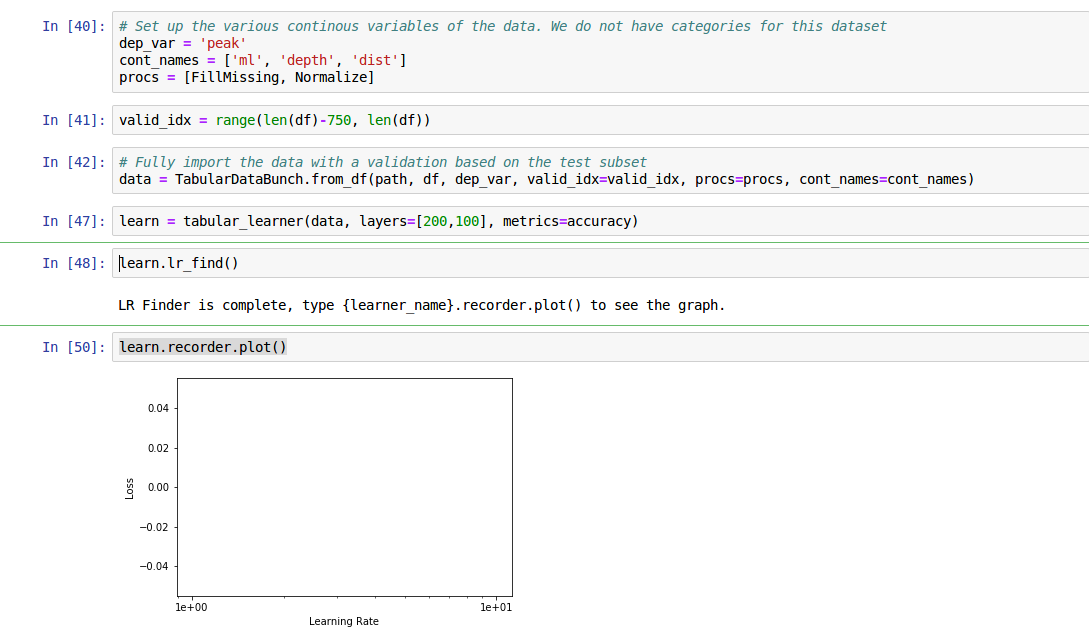
I’m trying to predict the “peak” value with the following continuous variables: “ml”, “depth”, “dist”, and “azmith”. However, when I try to plot the learning rate, I get an empty plot:
Sometimes, I run the exactly the same code and I get an actual plot though! In any case, no matter what I do, if I try to fit using any kind of LR, for example:
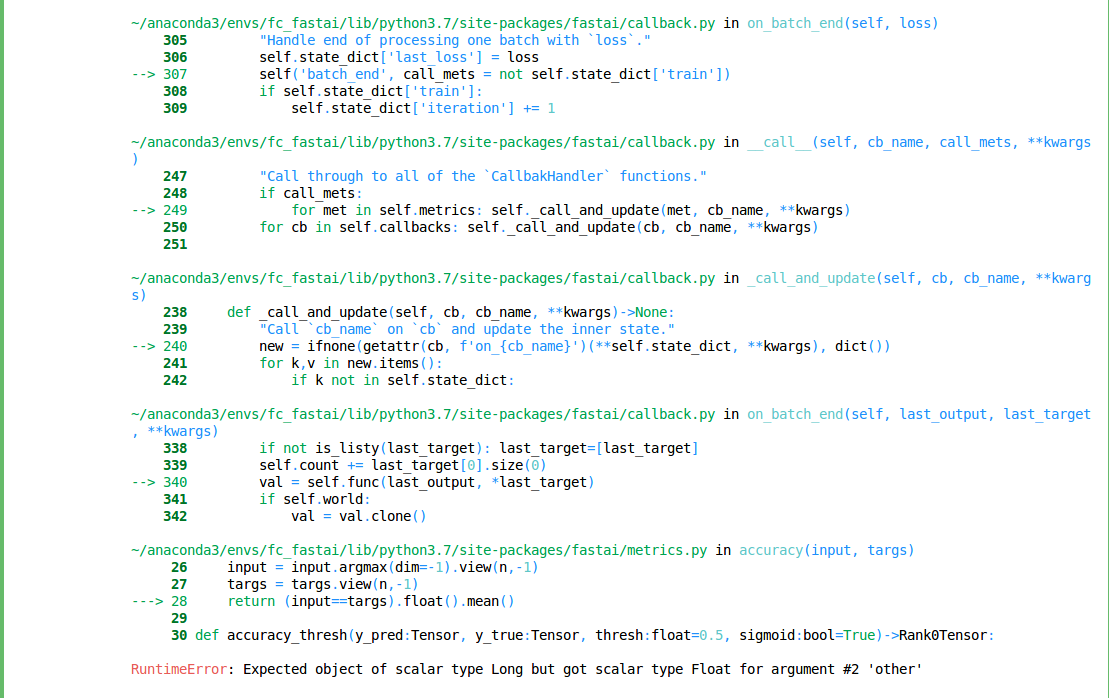
At a first glance it looks like your are missing the y_range option in your tabular_learner.
That’s why it will see it as a logistic regression instead of a linear regression problem and hence your metric is confused.
I was working off the Lesson 4 example which did not use y_range. I can now use it to get a consistent output at the moment (albeit not very good, but still).
It also seems the latter float error has to do with non-log metrics.
As of right now there are way too many parameters that I don’t understand. I’ll have to put this problem down at the moment and go through Lesson 6 and the Rossman example to understand a bit better what’s going on and come back to this.
I had a follow up question actually. Even with doing a proper y_range parameter, I keep getting the same runtime error as above if I use the metrics=accuracy. The only way I can avoid this is to use metrics=exp_rmspe. Do you have any suggestions regarding why this may be?
U can write a custom accuracy metric by yourself where u typecast the targ value as long.it will work fine but it is not a correct metric to use for these kind of problems , since accuracy is a classification metric.
In addition to that, I am not quite sure how the learner knows that @FCFC is trying to do regression and not classification.
Here is what I mean by that.
I haven’t worked much with the convenience function TabularDataBunch() and the likes, but more on the data block API. In order to build a (tabular) data bunch for regression, I specify that the output is FloatList. Namely, adapting from this fastai tutorial, I use something like:
I don’t see anything like that in FCFC’s code, and I don’t why playing around with y_range in the learner would help with this, as this comes after creating the data bunch.