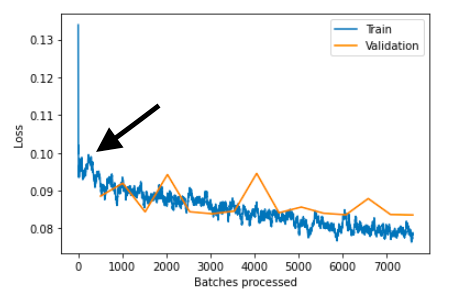
In Lecture 3 at 1:25:01, @jeremy stated that we need to check that our losses plot should get a bit worst and then go down.
So, I want to know whether this small rise in loss in this loss plot image is correct or not. In other words, Did I get the correct loss curve?
It is the Planet Understanding Dataset from kaggle.
And the Training Details are:
- Model: resnet34
- First Round Training=> lr: 5*1e-2, epochs: 5, img_size: 128
- Sec Round Training=> unfreezed, lr: (1e-06 ,5*1e-3), epochs: 5, img_size: 128
- Third Round Train=> freezed, lr:1e-5, epochs: 5, img_size: 256
- Fourth Round => unfreezed, lr: (1e-05,1e-04), epochs: 15, img_size: 256