Live coding 16

Hi @Daniel, I am glad you like Excel too. If Jeremy wants to share his Excel tips, I would love to attend it. BTW, Excel can perform Lambda function, it becomes more powerful.

I am aware you have attention to detail. So, I tried to answer as details as possible. Please feel free to ask further questions if anything is unclear to you.

Coming from an accounting background, Excel is my universal tool with a strong application in forecasting and scenario modelling. When I came across fast.ai, Jeremy used Keras at first; then, moved to Tensorflow. In the middle of the course, he changed again to PyTorch. For someone who learnt Python not too long, it was hard to cope with different frameworks. So, I focused on learning the underlying concepts. Jeremy used Excel to explain softmax (maths), cross-entropy (maths), gradient descent with different variations (maths and solver add-on), convolution (visualisation), and recommendation system (matrix multiply and solver add-on). So, I could follow along the Part 1 in 2017.

I am a visual person. I need to “see” before I can absorb new information/concepts. I found “dropout” was very unintuitive. WHY do we spend all the time to train a model (much slower and expensive to train at that time) but delete some of the features/activations the model just learnt??? But, by doing dropout, the model will generalise better!? I couldn’t process this concept in my head. :dizzy_face:
So, I did the visualisation (note: Jeremy explained the details operation in Lesson 8 1:08:42 few days ago). All of the sudden, I GOT IT!!! (For those who don’t have Excel, all the files were converted into Google Sheet previously)

Attending Part 2 in Spring 2018 was a big stretch for me. Reading ML research papers, with lots of maths notations, was intimidating. Again, I tried to learn the concept and immediately fell back into my Excel comfort zone. I managed to re-produce focal loss graph in Excel first and then re-produce it again in Python. So, I learned it twice. (I just realised it help to improve my forget curve). While I was running (and waiting impatiently) Part 2 notebooks, I kept using Excel to understand/experiment with the following concepts:

  • Gradient explosion for CycleGAN
  • Wasserstein GAN (comparing L1 and L2 losses)
  • Artifact when up-sampling images using different methods and kernel sizes

If you are interested, here is the repo. Feedback is welcome. :blush:

Over the years, deep learning frameworks and libraries can do most of the heavy lifting for us. We don’t even need to fine-turn cats and dogs classification anymore. Knowing the impacts and reasons for picking certain parameters/loss functions are far more important.

How useful or unexpectedly useful Excel has been for you?

Additionally, I use Excel extensively for project management (general projects or even deep learning projects) in my corporate career. I use it to:

  • develop checklists based on the concept of Work Breakdown Structure
  • keep brief minutes that contain decisions and actions only (a tab for each meeting, so I can follow up on actions items every meeting and make my team accountable for their tasks)
  • keep track of project deadlines, milestones and leaves
  • data collection registration (since we needed to collect our own ground truth dataset)
  • explore best visualisation options (much easier to change chart types in Excel than in Python)
  • mock up model specifications (breaking down into input, process, and output) to avoid misunderstanding and using the predefined output for User Acceptance Test later. (Very important for system customisation projects to ensure projects are delivered on time and on budgets)

I successfully applied the above with a multi-disciplines team, located in four different time zones, to deliver a deep learning project - using computer vision for digital pathology. Last year, my team published the finding in Nature’s Scientific Report. Most of the techniques we used were covered in Part 1. But, how to apply existing problems and execute them within limited resources is still challenging.

In summary, if Jeremy did not use Excel in his teaching, I would not contemplate learning deep learning at all. Without fastai, I might possibly still use Excel and work in Finance/Accounting. But now, fastai opens up a whole new world for me to explore.

PS. Thank you for all your detailed notes. They are very helpful. 深度碎片,加油!

10 Likes

Wow, this reply is a huge gold mine, thank you so much Sarada! I am digging into it now

1 Like

To reproduce this list in excel step by step should be a great exercise for me!

Wow, this is very nice! More advanced and challenging exercise!

Very true! It’s one thing to try the newly implemented techniques and say it works better by lower error rate, it’s another to ‘see’ how the new techniques behave differently and how the difference may contribute to better result.

This sounds very interesting! Love to learn more of how to build a dataset professionally using Excel from you someday.

So, you have actually implemented in Excel every step of your deep learning project from input to model building to output? Wow! That’s amazing! Love to learn more of the story of how you did it!

Congratulations! This is huge!

Yeah, Jeremy definitely should teach us his tips in using Excel particularly for deep learning. I guess we should give Jeremy more positive feedbacks on Excel with deep learning.

2 Likes

Sorry, in this case, not for the deep learning model. But, I used this approach to outline the specifications for proprietary software customization and delivered the project on the first date of a new financial year. So, possibly out of scope here.

3 Likes

I see, thanks for clarification.

1 Like

It is so intringing that one excel workbook can let you experiment on the foundations (forward, backward propogation or gradient descent) and essential techniques on improving gradient descent (e.g., momentum, Adam etc) of deep learning on a single neuron architecture (i.e., a simplest linear function y = a*x + b).

The first thing I want to experiment in the excel spreadsheet is to build a two-neuron architecture y = c*(a*x+b)+d (one linear function on top of another) instead of one neuron y = a*x + b in the excel. I don’t know much calculus, but what Jeremy showed us in the excel and lecture 5 2018 1:34:00 makes me willing to try.

I have no school learning in calculus, but I sort of understand the basics of derivative through fastai videos and Ng’s videos. So, I am really thrilled to see that Jeremy put both numerical and analytical derivatives of a and b with respect to error in the excel and showed that there is not much difference between these two types of derivatives in the example. (I further tested that running SGD with estimated/numerical derivatives of a and b, the error rate going down with very similar values to using analytical derivatives.) This way, even with 4 weights in 2 neuron architecture, I don’t need to worry about searching online for 4 analytical derviative formula, instead I can calculate their numerical/finite derivatives with almost a single formula.

\frac{\partial e}{\partial a} = \frac{(((a + 0.01)*x + b)*c + d -y)^2 -((a*x + b)*c + d -y)^2)}{0.01}
\frac{\partial e}{\partial b} = \frac{(((b + 0.01) + a*x)*c + d -y)^2 -((a*x + b)*c + d -y)^2)}{0.01}
\frac{\partial e}{\partial c} = \frac{((a*x + b)*(c + 0.01) + d -y)^2 -((a*x + b)*c + d -y)^2)}{0.01}
\frac{\partial e}{\partial d} = \frac{((b + a*x)*c + (d + 0.01) -y)^2 -((a*x + b)*c + d -y)^2)}{0.01}

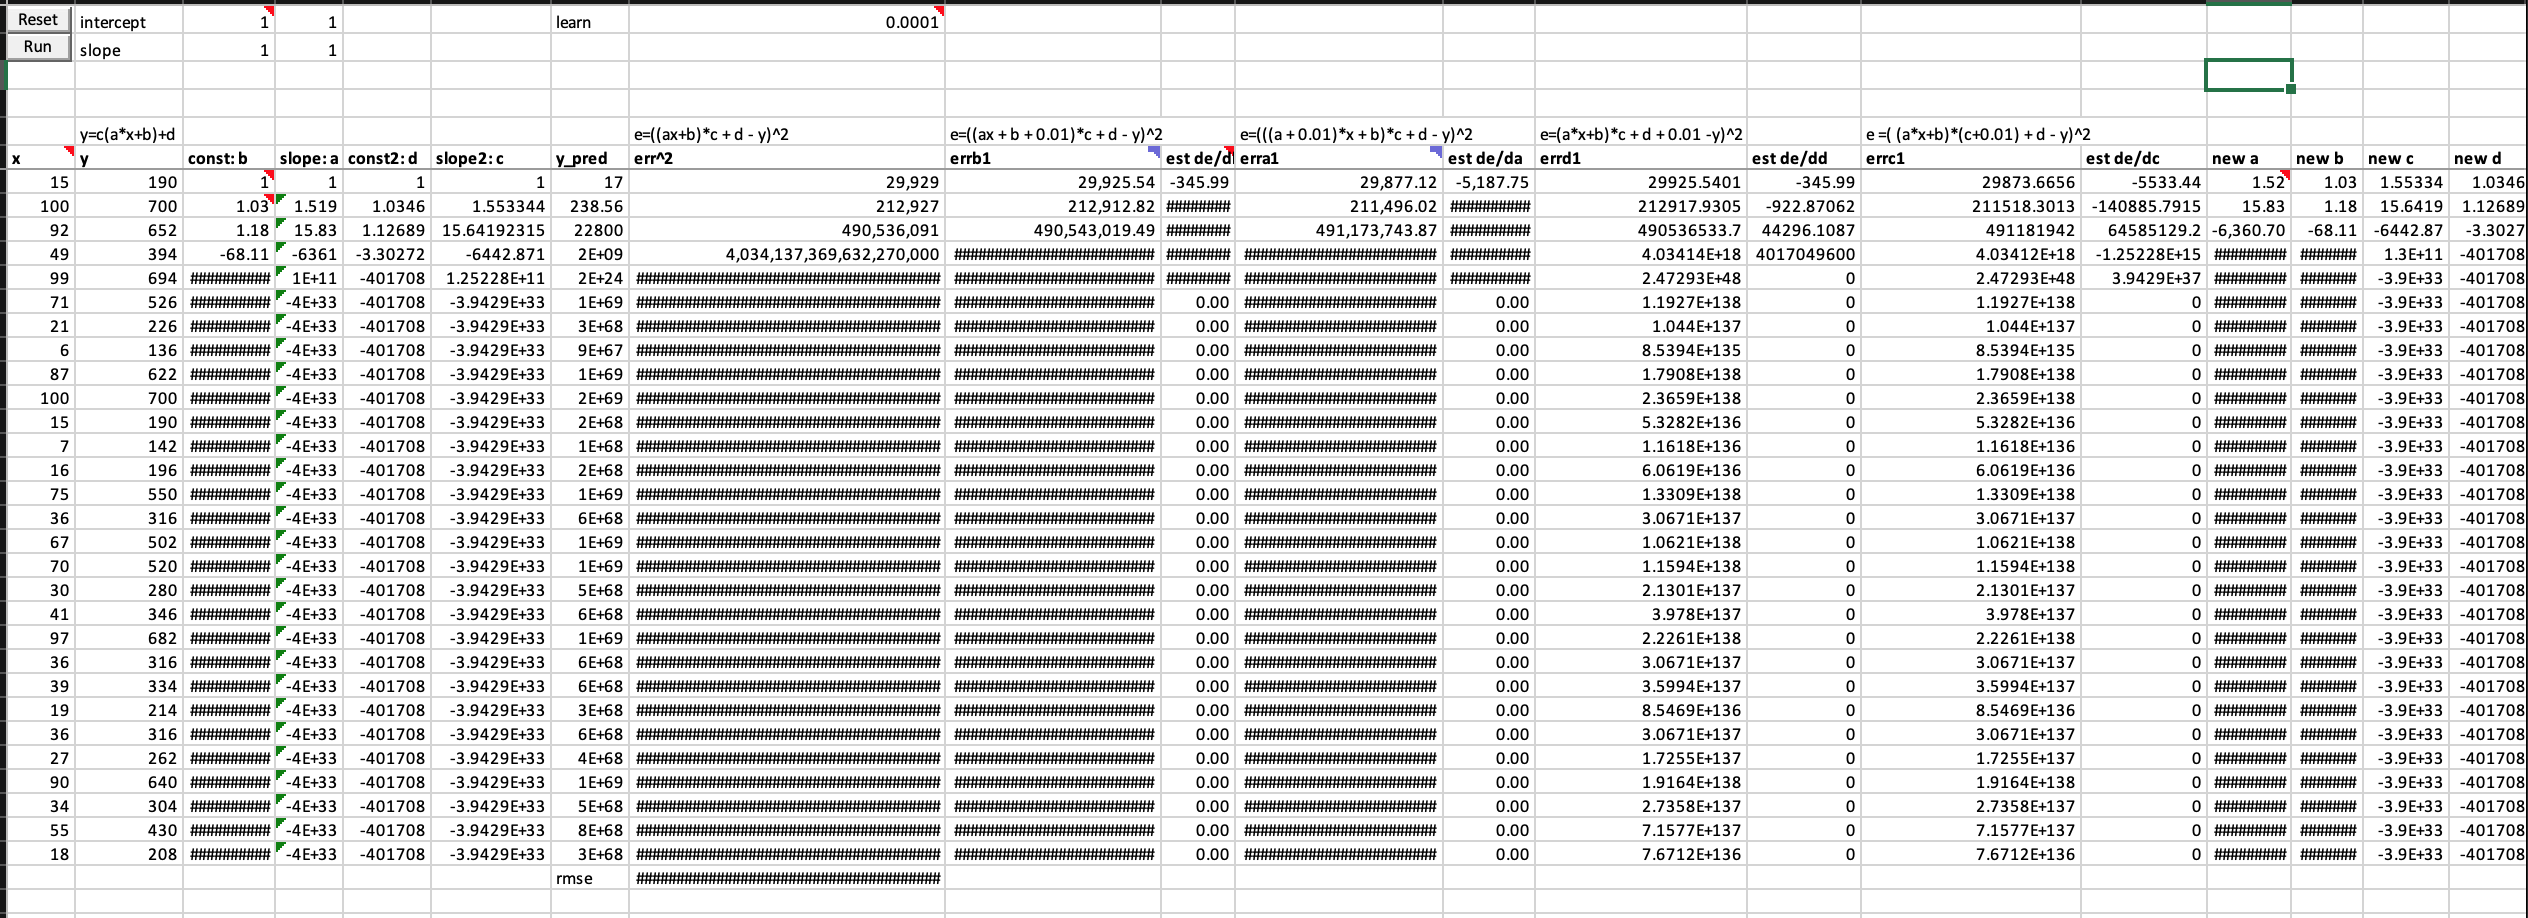
Are these correct numerical/finite derivatives of y = c*(a*x+b)+d? If not, what are the correct formula? I am not confident about it because error get exploded too fast.

Below is my worksheet named “basic SGD 2 neurons” in the workbook you can download from here

1 Like

Another question I have is about momentum.
From Basic SGD workshee, we calculate the updated parameter b by new b = old b - 0.0001 * de/db. Whereas in momentum, we use new b = old b - 0.0001 * a modified de/db, and the modified derivative of de/db is calculated using modified de/db = 0.1*de/db + 0.9 * its previous modified de/db. But where do the first modified de/db (-18.33) and the first modified de/da (98.246) come from? Jeremy didn’t mention them in the lecture above 1:53:44?

1 Like

I guess a good night sleep helped.

3 Likes

y = c*(ax+b)+d, where a, b, c, d are constant
y = a
cx + (cb+d), so ac and (cb+d) are constant

Therefore, it is the same as y = a*x + b

Walk away and think about what you tried to achieve. Don’t give up. We are here to help. :slightly_smiling_face:

PS. In your example, the constants are a=2, b=30, c=3 and d=10. With learning rate=0.0001, and initial value for constants are a=1,b=1, c=1 and d=1. It will take you many many iterations before you can reach b=30.

2 Likes

Based on your “data” tab, I replaced x as a sequential integer starting from 1, you can see their relations, just different slops(a vs ac) and interactions(b vs cb+d).

2 Likes

Tips: Trace Precedents and Trace Dependents are debuggers in Excel. Use Remove Arrows (a bottom below) to remove blue lines.

3 Likes

Thanks a lot Sarada!

You are very right, and it does boil down to a simple linear function with just larger constant ac and (cb + d). Also maybe the exploding error from early on probably is due to the large difference between ac and my initial value 1.

So, what was I trying to do? How did I come up with this y = c*(ax+b)+d?

I want to build a slightly more complex model to find our target y = 2x + 30. Jeremy used the simplest model y = ax + b with two parameters a and b, and I want my slightly more complex model to have more than 2 parameters. If we can think of the model in terms of neurons, then I can picture the simplest model as a single neuron with a and b as weights (without activation function). If so, could a slightly more complex model be two connected neurons (one has a and b and the other has c and d) without activation functions?

I wonder whether the missing of an activation function is the reason why two neurons are collapsed into one neuron essentially.

Then if I do add one activation function such as a ReLU to the first neuron, would it prevent the collapse? I wonder how would I prove it? If it does not collapse, then the formula to calculate derivatives below should be working I assume. (I will keep experiment to explore on these questions)

1 Like

Great tips, thanks a lot!

1 Like

Let me try to prove it via visualisation. Let Z as ReLu of a*x+b. In Excel, that is max(a*x+b, 0) or cell C6 in the example below. So, y = c*(ax+b)+d is a bigger linear function with “a bended elbow”. With ReLu, the formula should be: y = c*[max(a*x+b, 0)] + d

ReLu looks like below (with a 45-degree upward straight line when x is greater than zero). So, constants (a, b, c and d) impacts the slops (two different slops applied when x is greater than zero and x is less than zero) and intersections.
image

Does that make sense to you? Can you “see” the power of visualisation? That is how I learned and did all the experiments. :slightly_smiling_face:

3 Likes

I heard somewhere (maybe in one of Jeremy’s previous lectures) that if we don’t have a non-linearity at each layer , the result would be as if we had just one layer. I can’t remember where I heard that.

A neural network is an Affine-ReLU sandwich and you need the delicious ReLU “filling” in between the slices of Affine “bread” :smiley: :sandwich:

2 Likes

Thanks for the reply, Mike. You are absolutely right! The experiments I explored in the excel also confirm that models with ReLU makes training easier than without.

I will share more of the excel experiments later.

1 Like

In fact, based on my experiments, having two neurons (4 weights) without ReLU perform worse than a single neuron model, when the target function is a simple linear function with 2 weights.

1 Like

Thank you Sarada! As you have proved it with the data and graph, using ReLU the linear function becomes non-linear. In other words, with a ReLU between two neurons (a sandwich, as Mike reminded me of Jeremy’s analogy), a 2-neuron model becomes non-linear (meaning not a straight line anymore) therefore, a collapse won’t happen.

I haven’t figure out how to do graph as nicely as yours, but I did replicate the same data and a graph which however is different from yours. Please correct me if my graph is wrong.

1 Like

The difference is I set the x value between -80 to 120 with a step of 10. So, I can draw a line chart easily.

You used random numbers to generate x. Because Excel can treat each row as a data point. So, the chart may not the true reflection of the data. Check your "Horizontal (Category) Axis Labels, the setting should link to the cells for x value (not hard code value generated by Excel). I pushed my file to your repo. So, you can inspect it.
image

Excel tips: Highlight data and then select a chart type. Delete those columns you don’t want in the chart.

3 Likes

Now I have a more clear view of what I tried to experiment.

First of all, Jeremy used graddesc.xlsx file to demonstrate the following things for us:

  • how are weights updated using SGD?
  • how better techniques like Momentum, Adam etc can speed up the training with SGD?
  • all these techniques can be implemented with a linear model with 2 weights.

To better appreciate Jeremy’s teaching above, I want to do the same above with a slightly more complex model. To be more specific, I want to train a 2-neuron (4 weights) model or a model of two linear functions (one on top of the other) to find the simple linear function y = 2x + 30. In Jeremy’s spreadsheet, he used a linear model y = ax+b to find y=2x+30. So, my model is slightly more complex.

Is my model smarter and faster than a simple linear model?

At first, I expected my model to be smarter may even be faster as it is slightly more complex. However, it’s error exploded without finishing one epch of training, not mentioning it is so much worse than the 1-neuron model by Jeremy.

Jeremy’s 1-neuron model has error of 151 after 1 epoch

Question: Why and how do my errors get exploded? I have not get my mind around on this. I guess I need to find a way to visualize it.

Can I get the training easier for my model by giving it better initial weights?

By giving a better weights initialization, yes, I can only finish 1 epoch and then exploding errors. The error is better but still much worse than 1-neuron model.

What if adding a single ReLU to the first neuron of my 2-neuron model?

My model can keep training without exploding errors. But my error is still much greater than 1-neuron model.

Here, I’d like to propose some interesting findings below. The updated spreadsheet can be downloaded here

When training to find a simple linear function y = 2x + 30:

  • 2-neurons without activation or ReLU is not simply collapsed into a single neuron, because it can hardly train and when it finishes an epoch, the error is much much worse than a single neuron model.
  • 2-neurons model with ReLU can train freely, so ReLu makes multi-neuron models working.
  • but this 2-neurons with ReLU still train much slower than 1-neuron model

Those findings above are interesting, because I can’t explain why exactly. To find out why, I plan to try to visualize the experiment data to get a feel about how error get exploded, and read fastbook chap 4 and other related chapters.

Any advice on how should I explore and experiment on those questions above are very very welcome.

2 Likes