Hello everybody!
After training the last, Resnet-ish CNN I plotted the losses and metrics with:
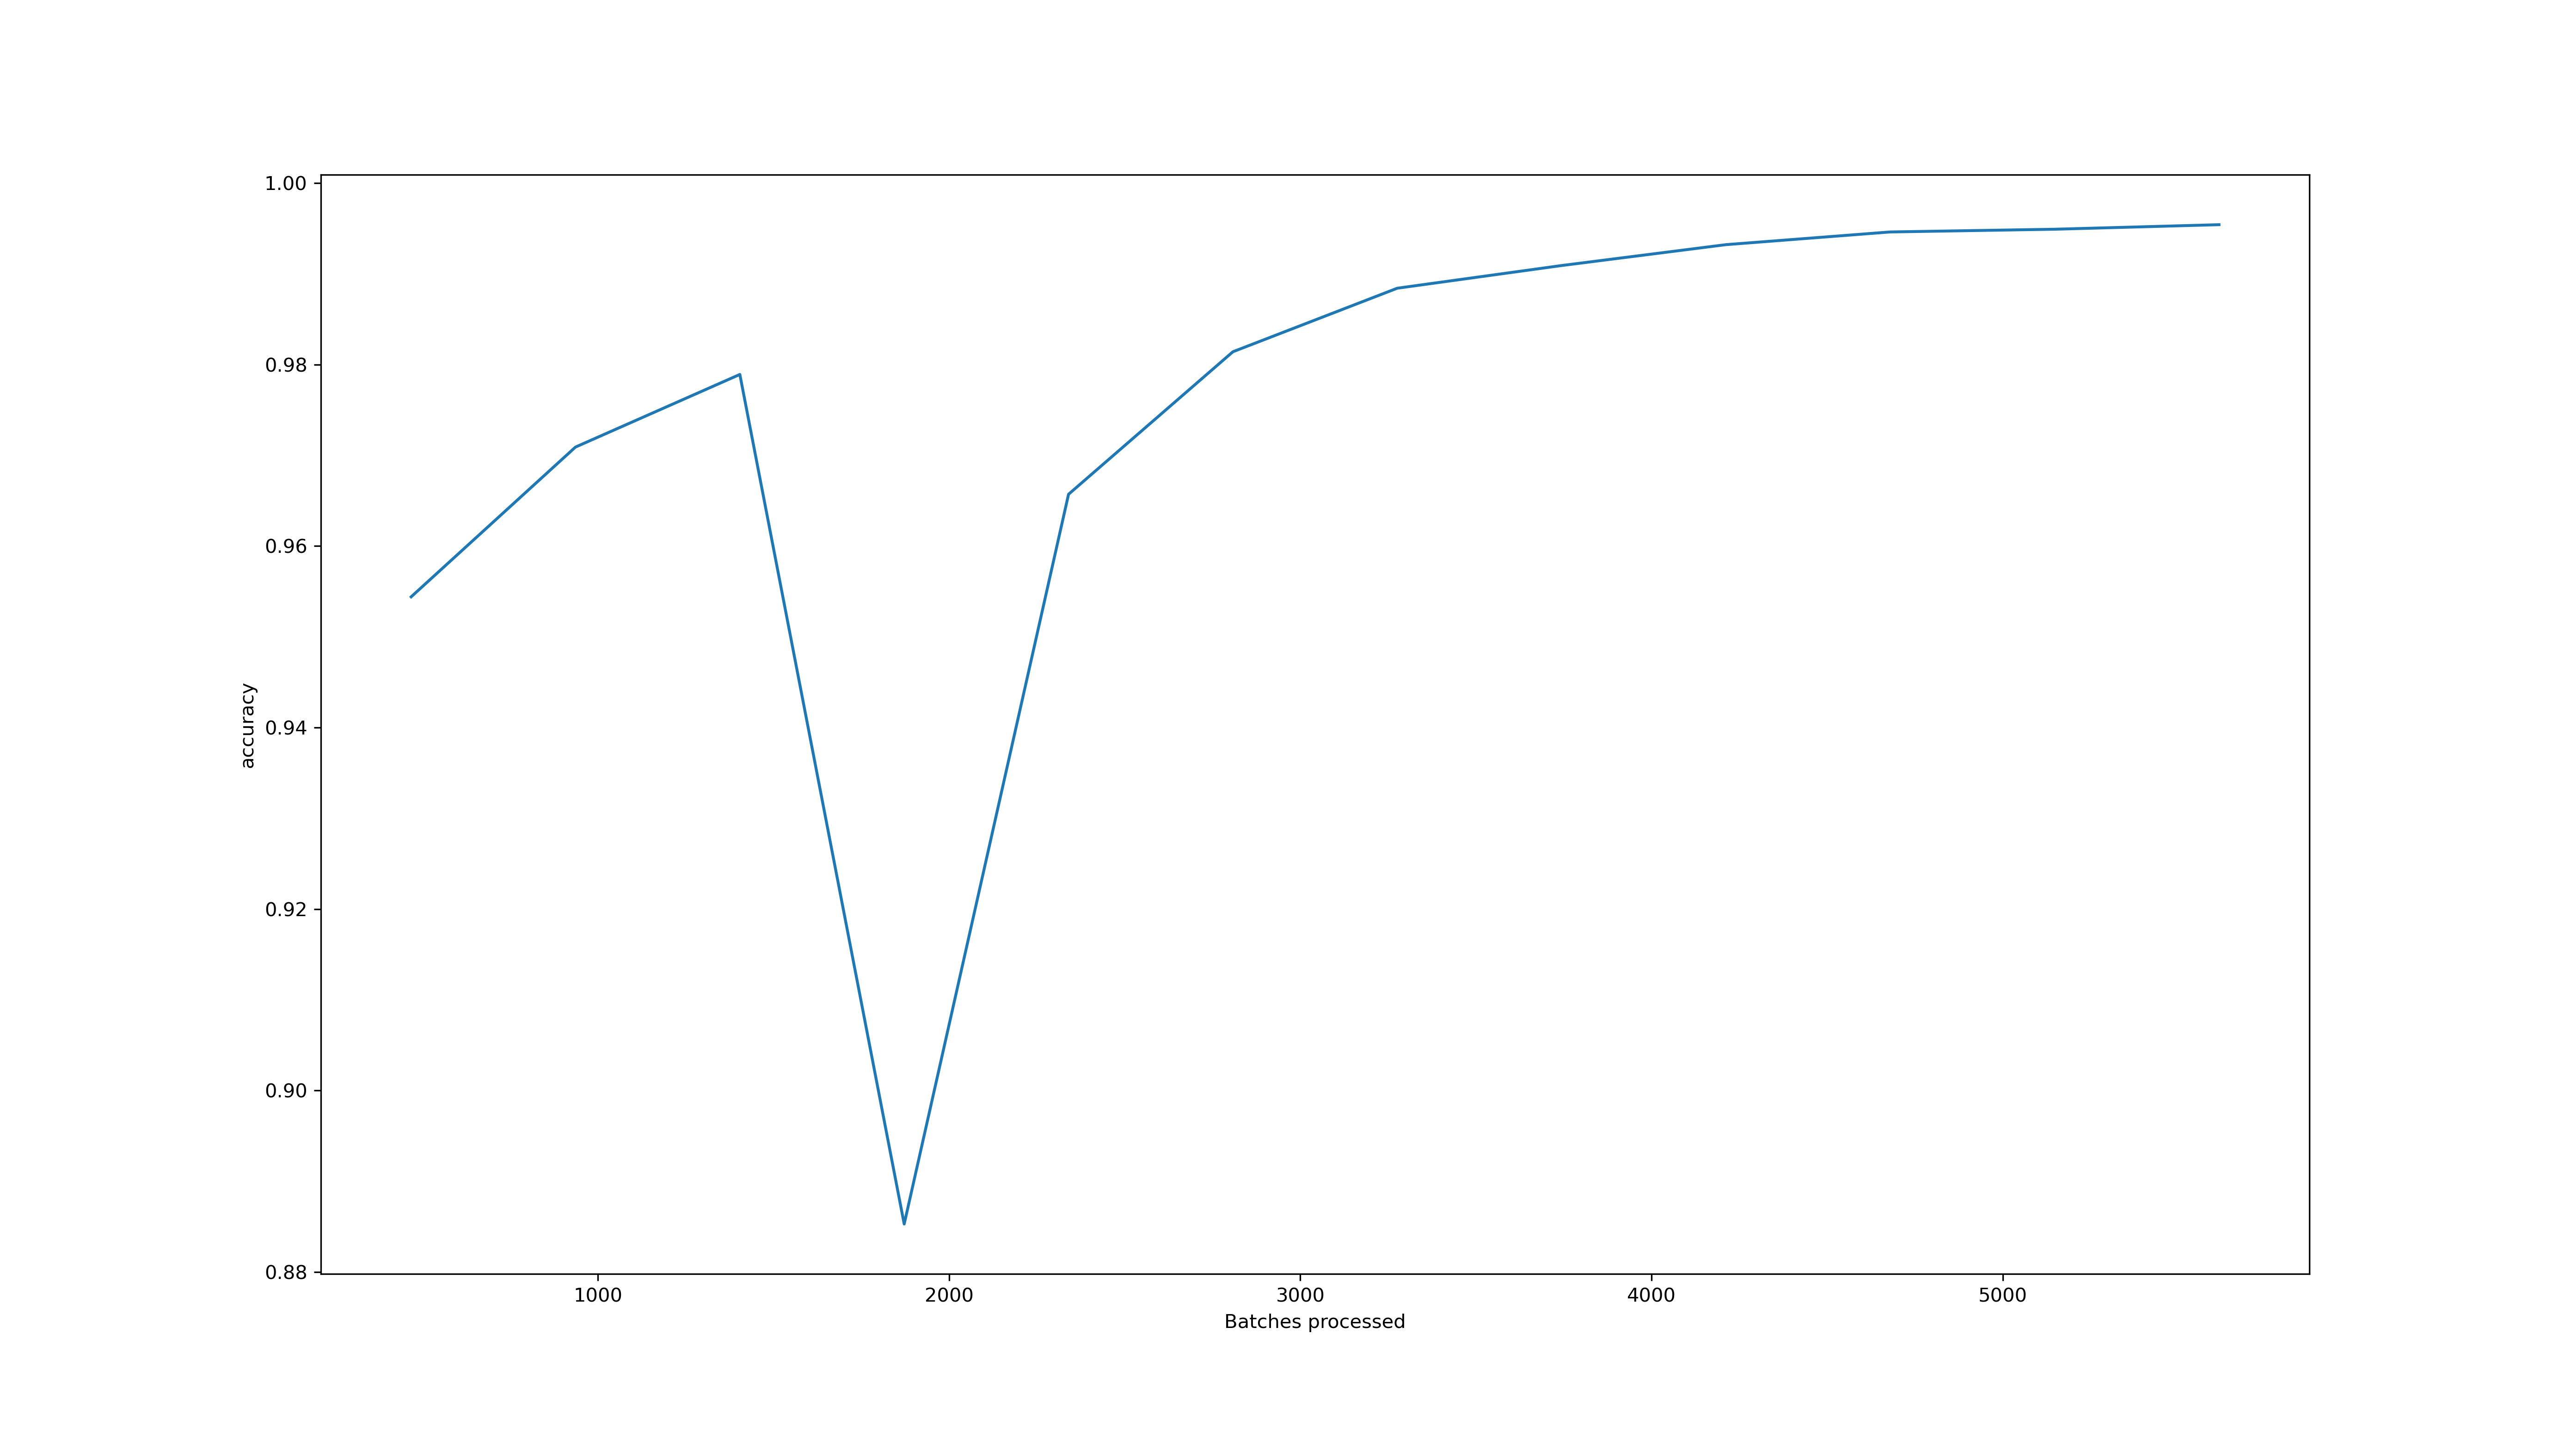
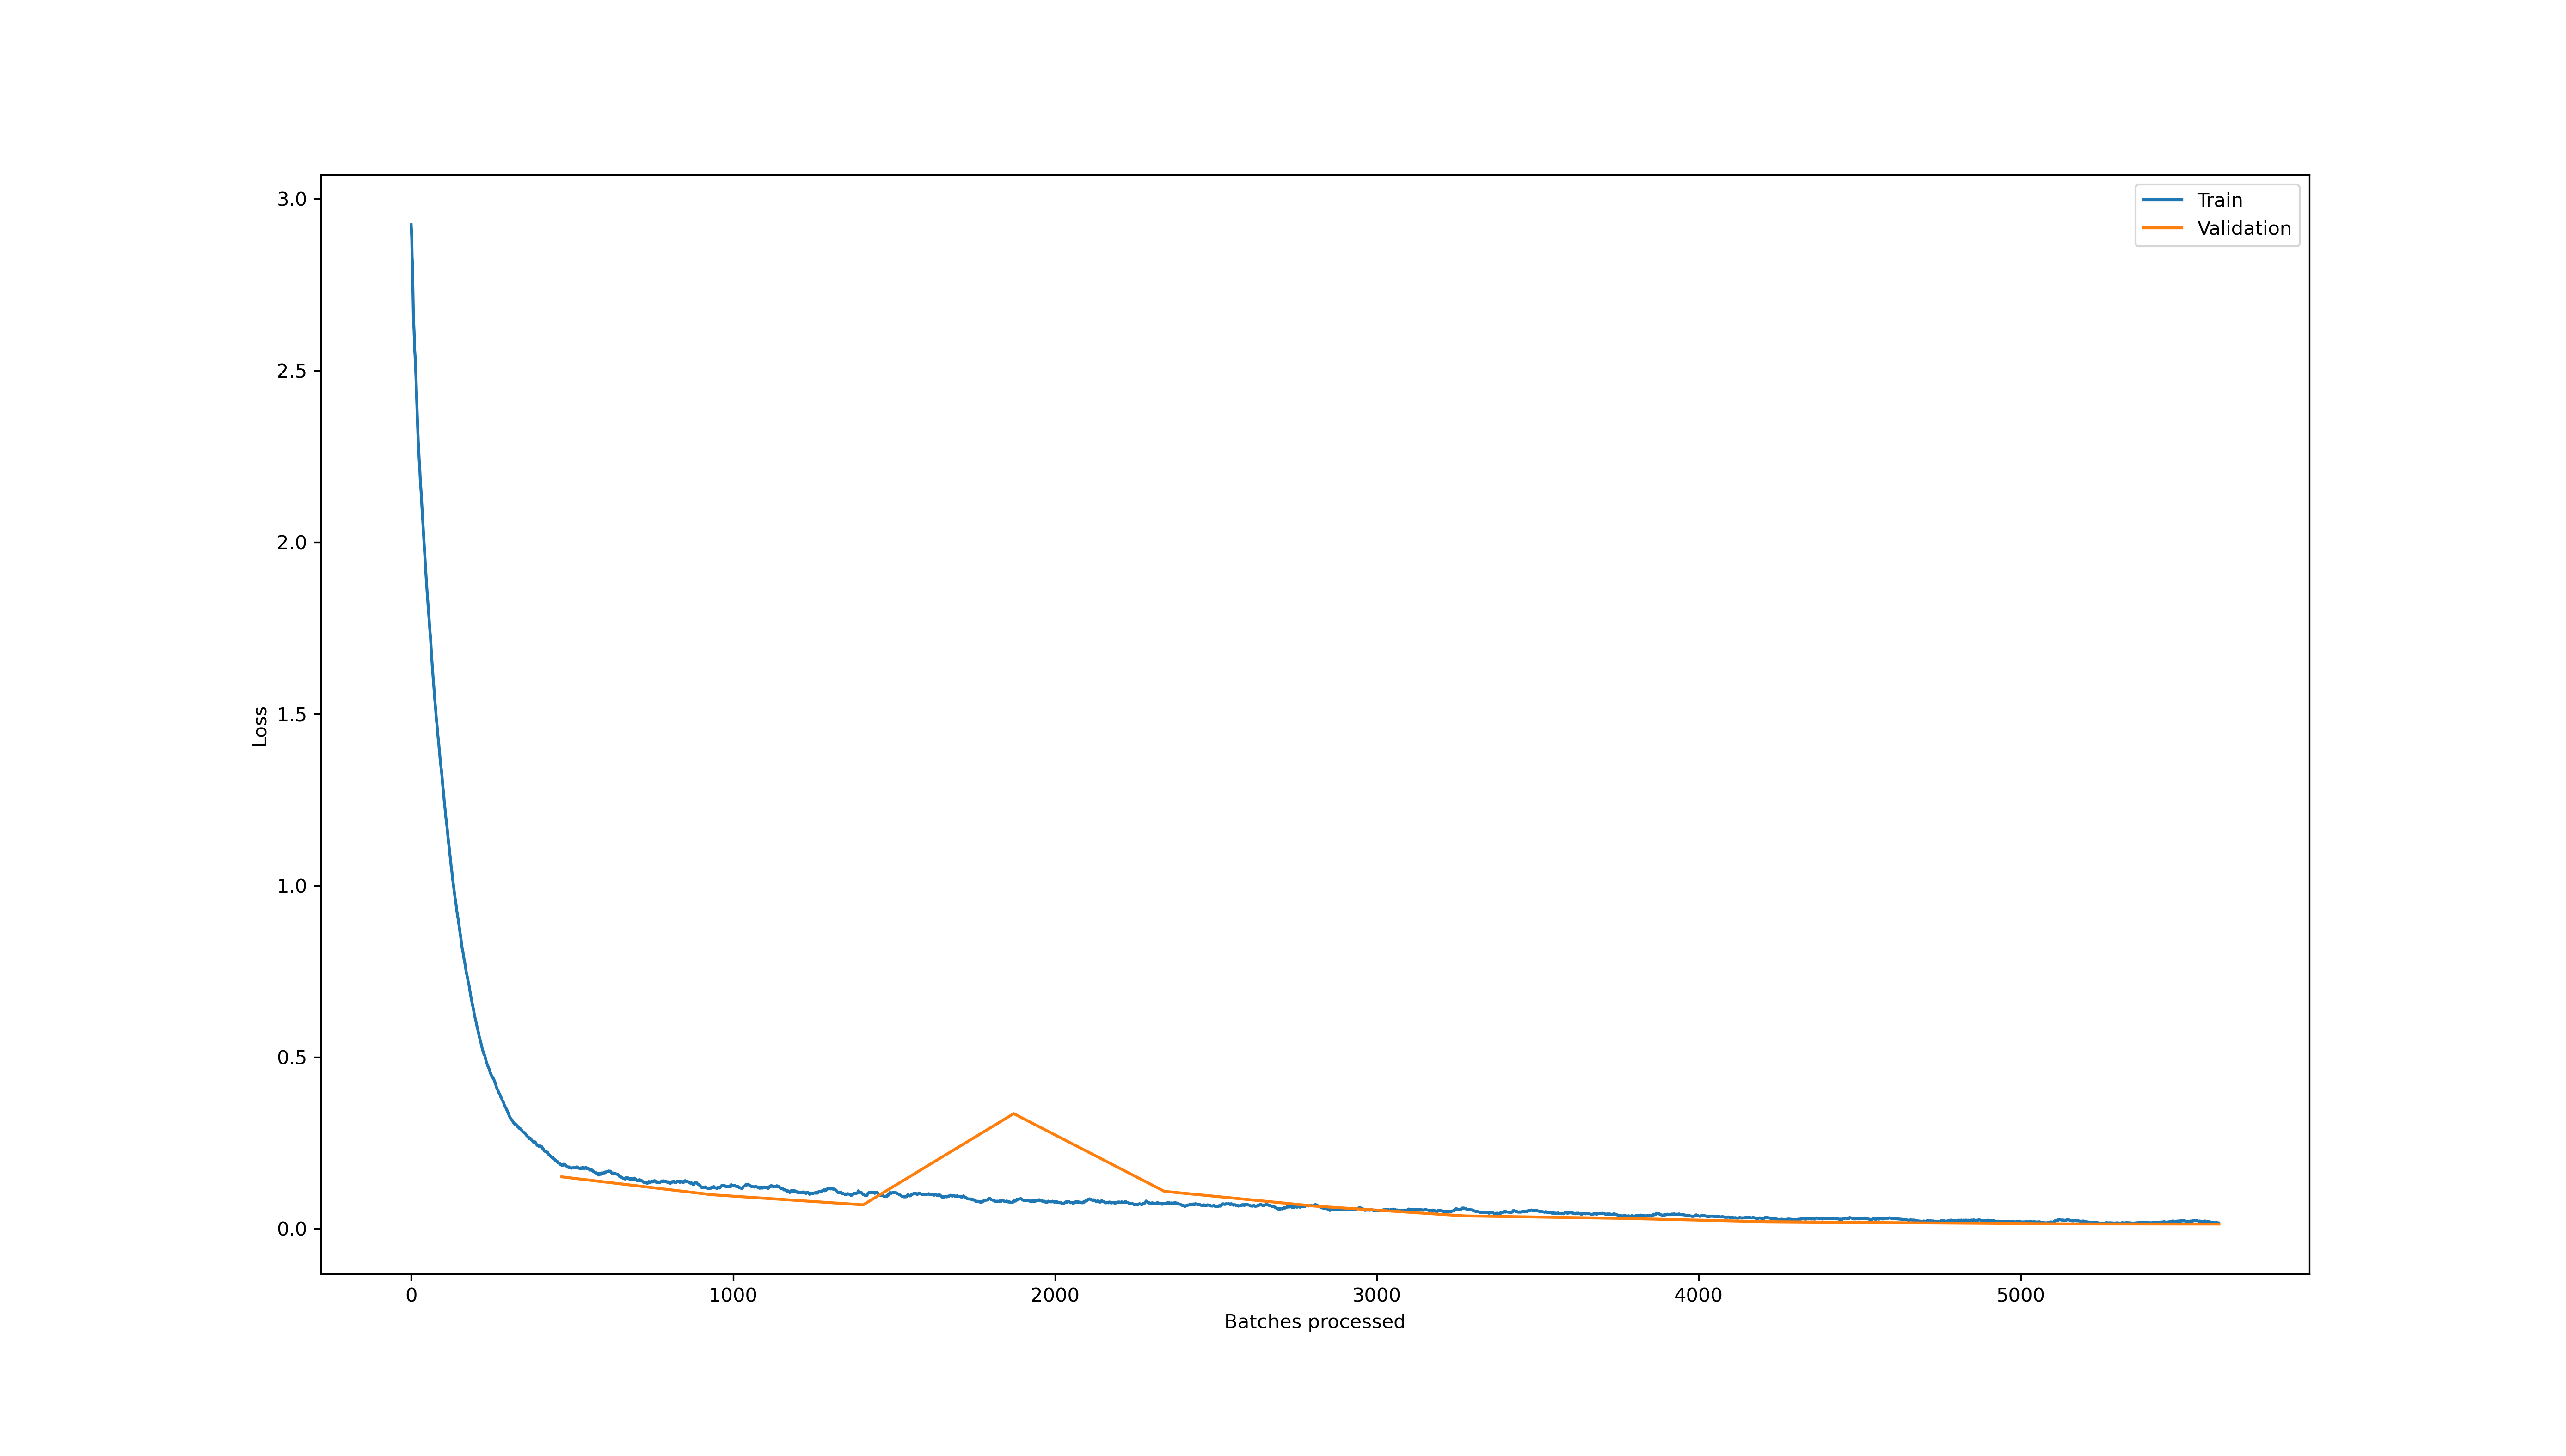
learn.recorder.plot_losses()
learn.recorder.plot_metrics()
And got the following graphs:
Why did the validation loss spike around epoch number 2000?