That works for me - great article! I submitted a pull request to fix some small typos - I think it would be good to play about with the styling a little bit so the text is centered in the page and the tables are formatted a bit more clearly. I’m not familiar with fastpages but I’m sure there’ll be a way to configure that somewhere in the setup!
Thanks! I merged your pull request.
I agree with you on the formatting issues. Internally, it uses Jekyll which isn’t rendering well here on Git. On the markdown, it looks well, the tables come with borders and other formatting is intact but when shifted to git, it comes in raw format.
1 Like
Hello! it looks like on the side_scorer function below:
def _side_score(side, y):
tot = side.sum()
if tot<=1: return 0
return y[side].std()*tot
I am struggling to understand why multiplying the standard deviation by “tot” matters and why we are penalising the side_score if a lot of elements end up in one particular split.
I see that we of course normalise by dividing the final score by the length of the dataset but why did we choose to multiple in the first place
1 Like
At 19:30 in regards to bagging and random forests, Jeremy says creating subsets by grabbing a random 50% will create uncorrelated models, but there must be a limit to this, right? At some point I’ll have grabbed all of the possible subsets and any additional subset I grab will be a copy of a previous subset, and thus have a correlation of 1 with another subset.
This is probably unlikely for any reasonably sized dataset, but I assume the intuition still holds if I by chance grab a subset where only one element is different. Slightly less for 2, 3, or 4 elements, and even less for 50, 100, etc. What does reasonably uncorrelated look like in practice? How big does the dataset have to be for the models to meet that bar?
Also, I now see that the get_tree function in the notebook uses random.choice(n, int(propn)) to get a prop sized bucket, but it does it with replacement. Would it be better or worse to pass random.choice(n, int(propn), False) to get samples without replacement? In my tests on the Titanic set, I think I’m getting better results, but is making the selection with replacement making the buckets more or less correlated?
If there it takes you 1000 subsets to encounter a situation, then the impact of that correlation=1 subset will be 0.1% on the result. YMMV IANAM**
**Mathematician
Perhaps I am missing something, but it does not seem obvious to me how a Random Forrest would produce continuous outputs.
Does the continuous spectrum of potential outputs have to be bucketed up into a series of categories which the trees choose between? e.g Age: 0-5, 5-10…
Random Forest predicts a continuous value by taking the average (or sometimes the median) of the outputs from multiple decision trees. Each decision tree in the Random Forest predicts a numerical value, and the final output is the average (or median) of these individual predictions.
Oh I realise my misunderstanding, each leaf node will produce it’s prediction based on the average of its residual data. For some reason I wasn’t seeing this, thanks!
1 Like
I am trying to build a classifier for a very simple task - Bike or No Bike. I have street imagery captured by motion sensitive cameras. Bikes could be present either in center of the image or left/right extremes. Bikes can be small when far from camera or big when close to camera. So, there is a very nice diversity in the dataset.
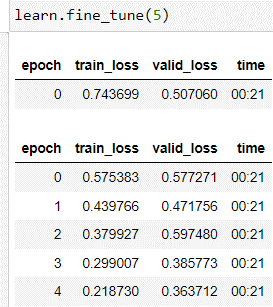
I have this data for about 80 locations in my city. I thought of developing the first iteration of the classifier on a small dataset that is choosing only 1 location which has about 300 images with bicyclists and 350 images without bicyclists. Each image is of resoltution 1088x1920 (HxW). I resized it to 272x480 and trained a resnet50 with default
learn = vision_learner(dls, resnet50, error_rate)
learn.fine_tune(5)
This uses default learning rate of 0.001 and this gave me an error_rate of 0.066 (which looks good to me now).
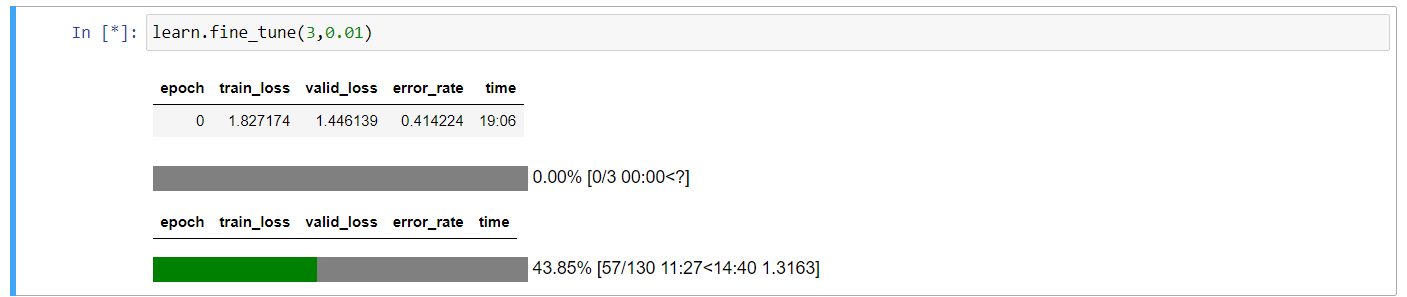
But then, i wanted to experiment with learning rate and hence i used
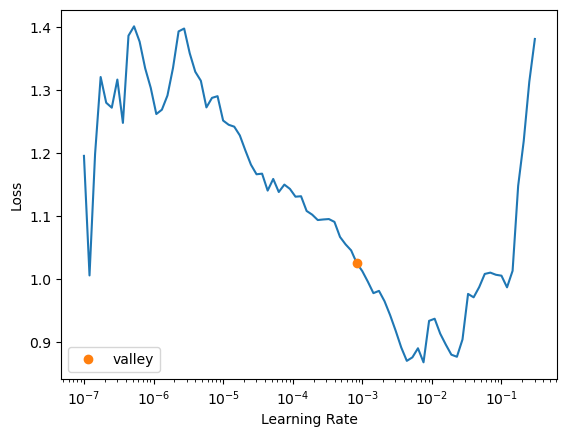
learn.lr_find()
which looks very weird.
Also, on re-running the code with different architecture ‘efficientnet_b0’, I didn’t see error_rate as metrics
Anyone know about these 2 issues? I am more concerned about why lr_find was so having so high peaks and depressions at very low learning rate.
I figured out on my own. I am not deleting this post so that if anyone else also face something similar, they can refer it.
- I was trying a lot of architectures to see which one is best. I remember, I ran
learn.lr_find()afterlearn.fine_tune(6)step instead of running it before this. - I should assign
error_ratetometricsby writingmetrics = error_rate. On doing this, I could see the metrics during the finetuning.
1 Like
i am having a trouble in lesson 6 of random forest part,
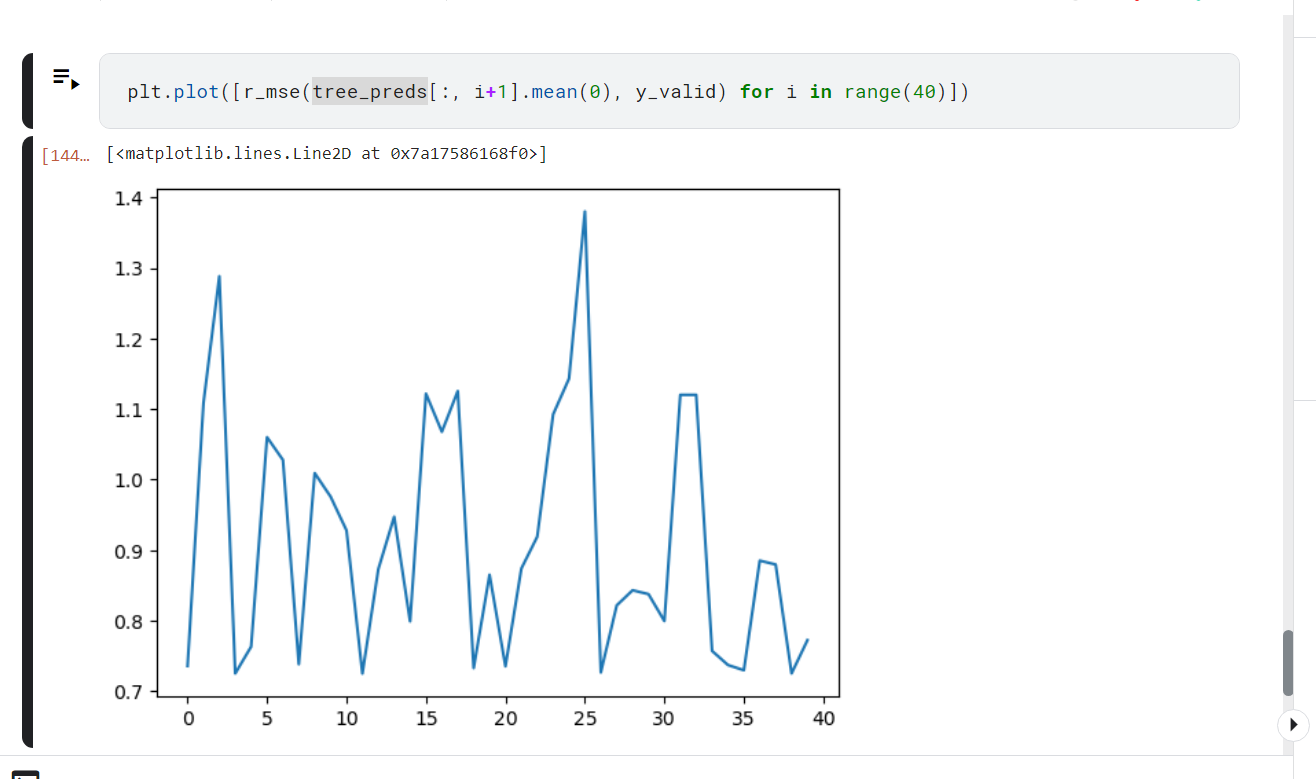
this image shows the graph of r_mse VS number of tree, as you can see, line is supposed to be smooth. However, it is not. if someone can help me understand what is happening.
Does the order of the columns matter with RandomForests? I’m learning to use ColumnTransform and Pipeline classes (from sklearn) to streamline the preprocessing steps. One of the features of ColumnTransform is that it changes the order of columns of the original data frame. When I passed the transformed data frame through the RandomForestClassifier I found that my mean_absolute_error was about 1% worse than when I performed the transformation manually. I assume that the order of the columns should not matter and the increase in MAE was purely due to the randomness of the random forest, but it wanted to double-check with someone who knows how random forests work under the hood. cheers, Tony
Hey @tofunmi, were you able to understand this? I am also struggling to understand this.
Hey @ismailmo, thats a nice explanation, but I am still struggling to understand the intuition behind the whole score function - how are we trying to measure impurity here and why we have used standard deviation here?
Thanks in advance!
Hi there, I hope I am not late ![]() .
.
Standard deviation is the average amount of variability in a piece of data. It tells how far each value lies from the mean, on an average.
This side score is calculated for each “side” (or each set of rows in the split column) of the column and added together. Each side score tells us how similar each row within a side/group is. Lower the score, lower the impurity (or higher the similarity) and vice-versa.
I believe the other aspects of this function have been explained well by @ ismailmo.
I hope I was able to answer your question.
Hello, i’ve got a question about third line of code below:
def get_tree(prop=0.75):
    n = len(trn_y)
    idxs = random.choice(n, int(n*prop))
    return DecisionTreeClassifier(min_samples_leaf=5).fit(trn_xs.iloc[idxs], trn_y.iloc[idxs])
random.choice() as far as I know can give the same number more than once, is it okay for random forest or should there be maximum of 1 number in each subset?
I have a question about these functions in the “How random forests really work” notebook.
def iscore(nm, split):
    col = trn_xs[nm]
    return score(col, trn_y, split)

from ipywidgets import interact
interact(nm=conts, split=15.5)(iscore);
interact(nm=cats, split=2)(iscore);
Why is split set to 15.5 for continuous columns and 2 for categorical columns?
My understanding, based on the sklearn.ensemble.RandomForestClassifier docs, is that trees are fit with bootstrap=True by default, which I understand means that they are sampling from the training set with replacement.
The source code also states this ("random samples (with replacement, a.k.a bootstrap)"):
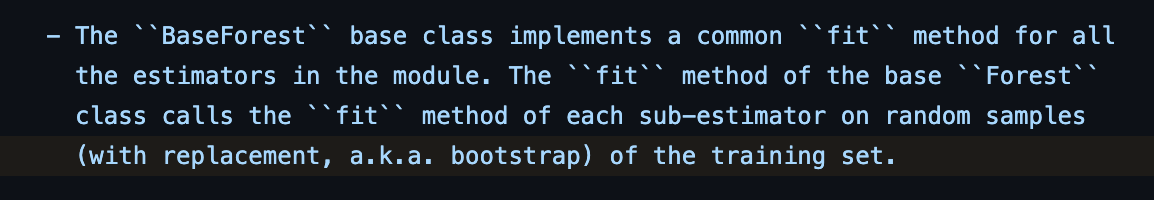
So, based on that I would think that yes, it is okay to sample with replacement.
1 Like
This is a good question and I don’t think there was an explanation anywhere explicitly about the split value. I’m guessing it is arbitrary?
Here are the ranges and the mean of all continuous variables in the dataset:
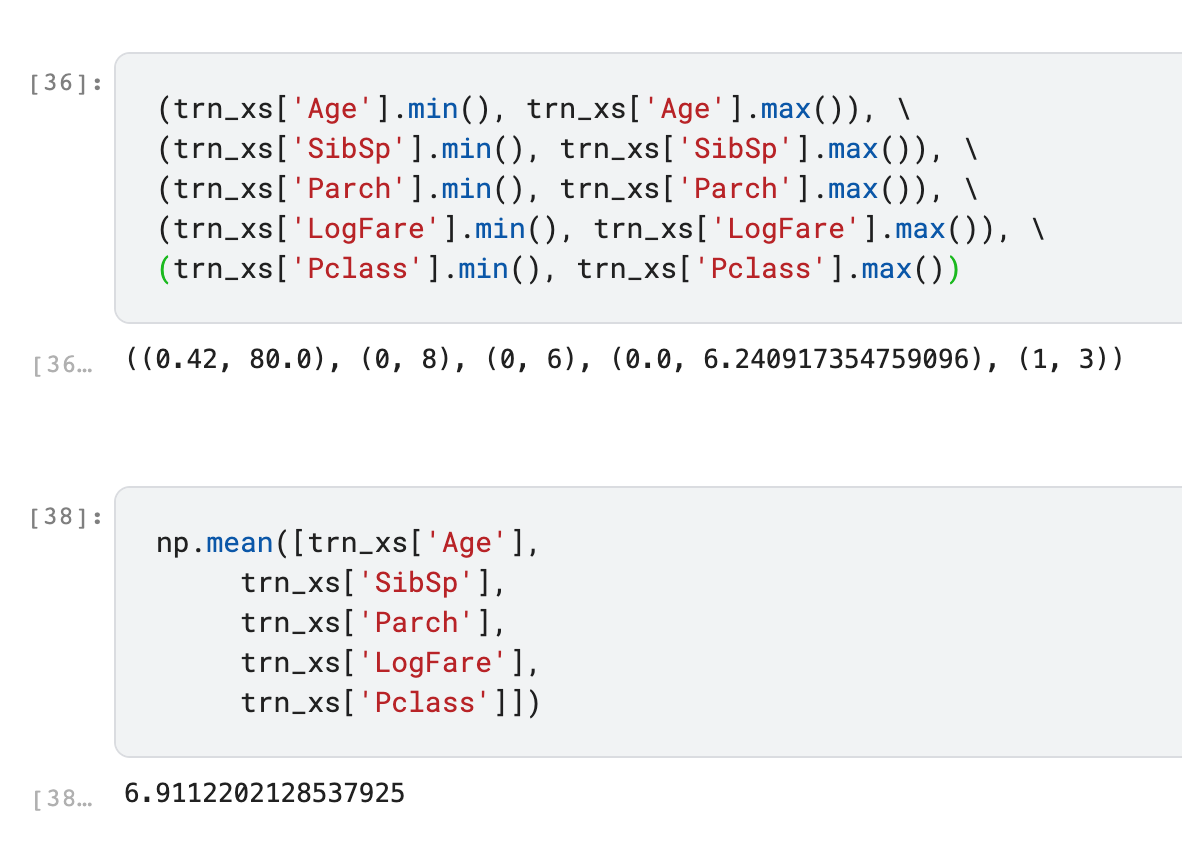
So I would assume that split=15.5 is used to account for the larger Age values, since the other continuous columns have a max of 3 to 8.
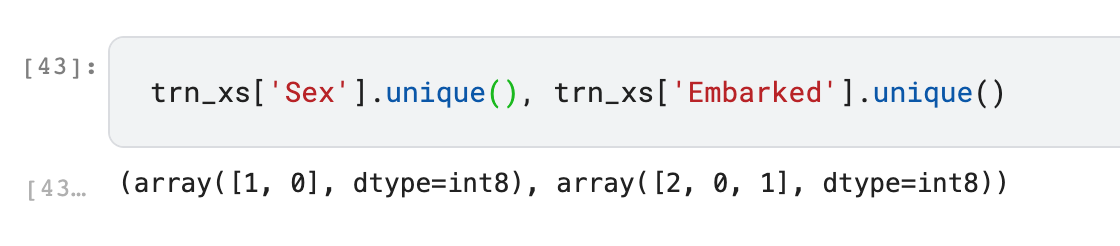
What doesn’t make sense to me as much is why the split value is 2 for the categorical variables, since Sex has a maximum of 1 and Embarked has a maximum of 2: